Copyright
©The Author(s) 2022.
World J Clin Cases. Sep 26, 2022; 10(27): 9714-9726
Published online Sep 26, 2022. doi: 10.12998/wjcc.v10.i27.9714
Published online Sep 26, 2022. doi: 10.12998/wjcc.v10.i27.9714
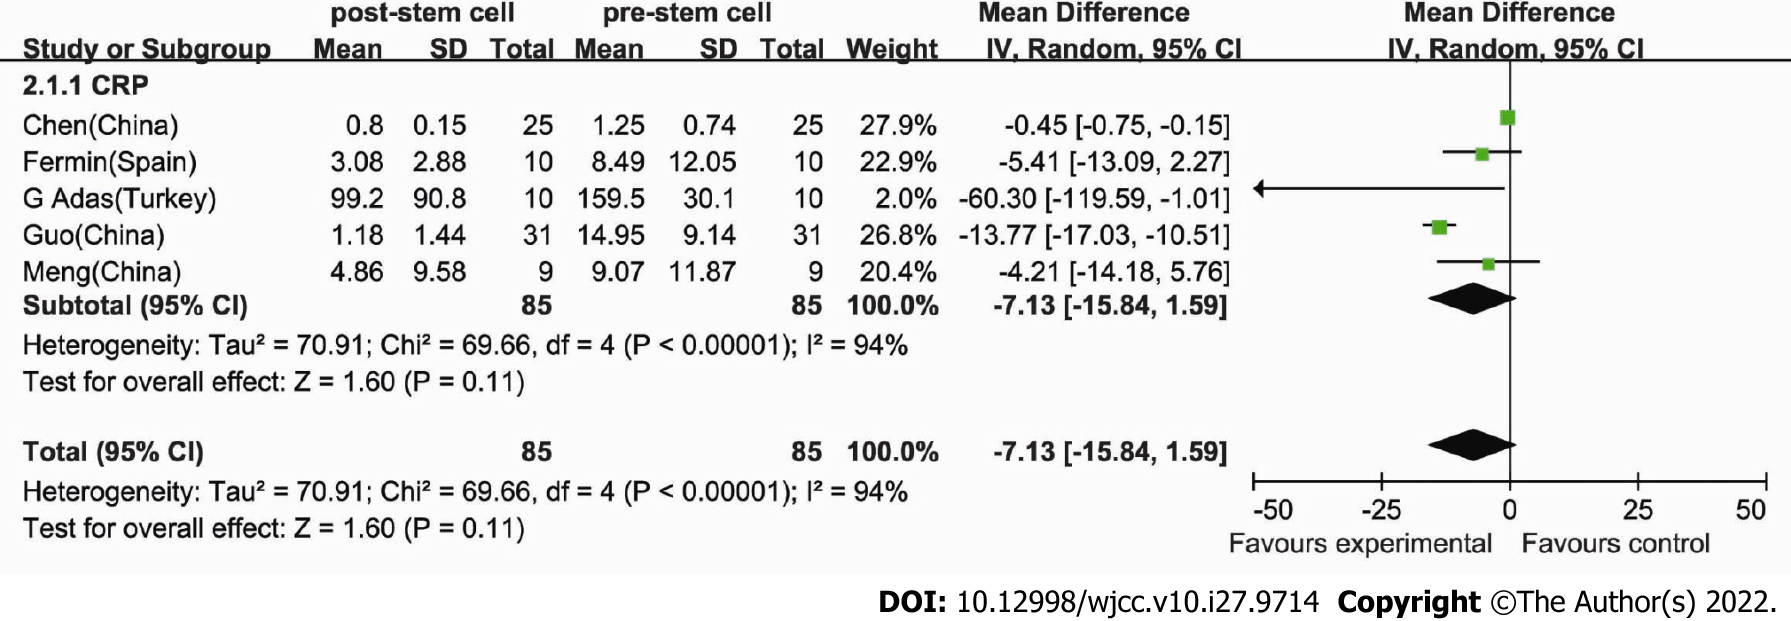
Figure 3 Comparison of C-reactive protein.
The heterogeneity was 94%, and the random-effects model (Mantel-Haenszel method) was used. Each study is represented by a square, the center of which denotes the mean difference for that study. The size of the square is proportional to the information from that study. The two ends of the horizontal bars denote the 95%CI. The black diamond gives the combined results of all studies.
- Citation: Cao JX, You J, Wu LH, Luo K, Wang ZX. Clinical efficacy analysis of mesenchymal stem cell therapy in patients with COVID-19: A systematic review. World J Clin Cases 2022; 10(27): 9714-9726
- URL: https://www.wjgnet.com/2307-8960/full/v10/i27/9714.htm
- DOI: https://dx.doi.org/10.12998/wjcc.v10.i27.9714


