Copyright
©The Author(s) 2022.
World J Clin Cases. Sep 26, 2022; 10(27): 9657-9669
Published online Sep 26, 2022. doi: 10.12998/wjcc.v10.i27.9657
Published online Sep 26, 2022. doi: 10.12998/wjcc.v10.i27.9657
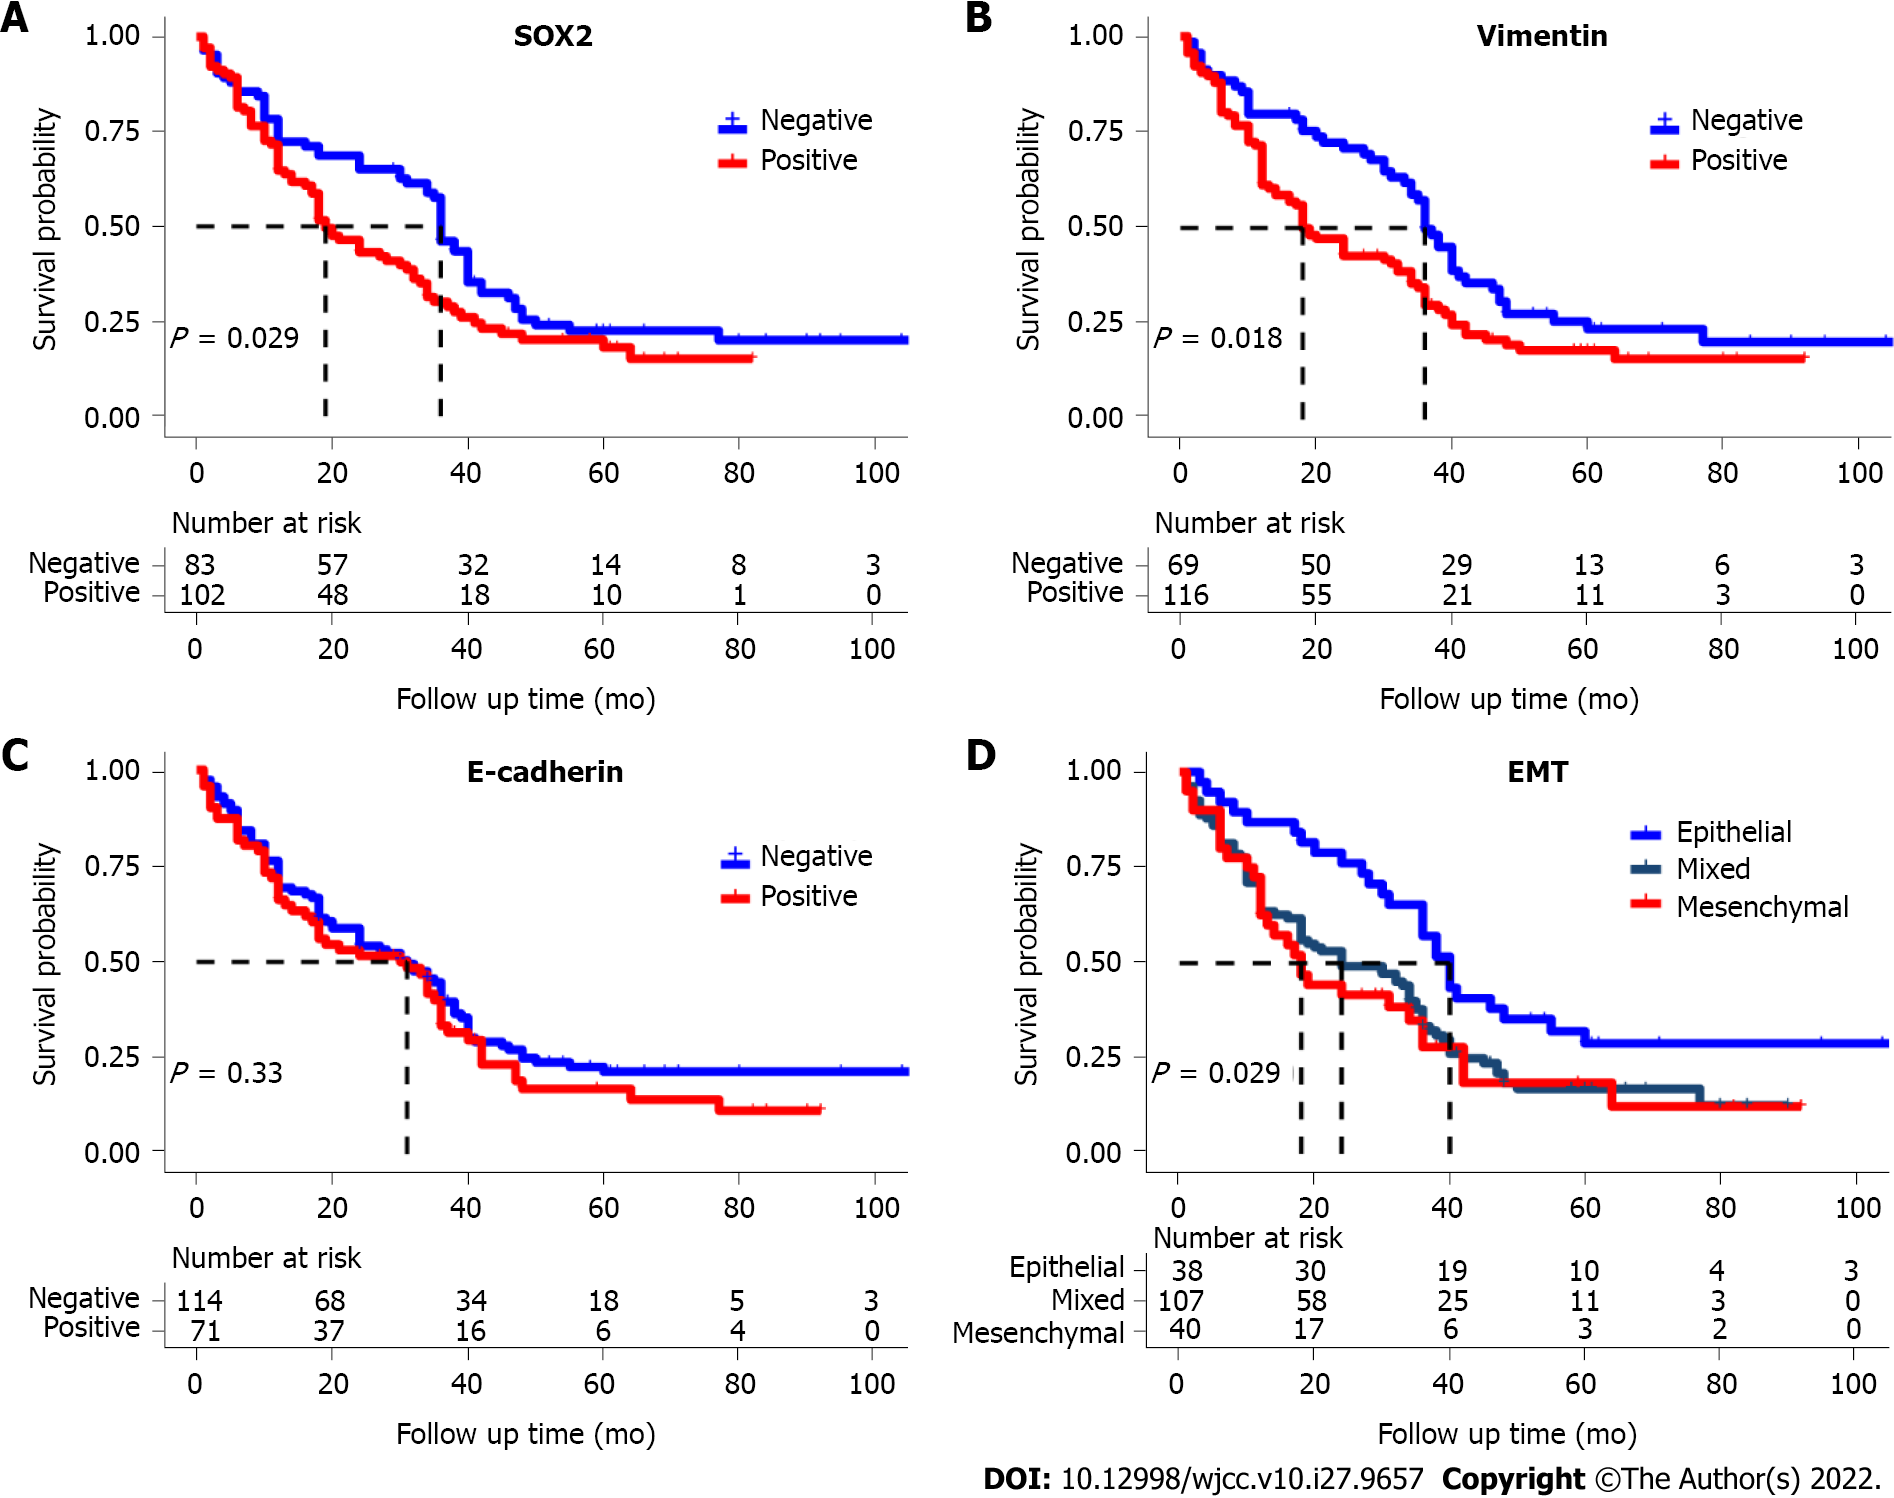
Figure 2 Kaplan-Meier curves.
A: Kaplan-Meier curves for overall survival of esophageal squamous cell carcinoma patients with sex determining region Y-box 2 positivity vs negativity (P < 0.05); B: Vimentin positivity vs negativity (P < 0.05); C: E-cadherin positivity vs negativity (P = 0.33); D: Different epithelial-mesenchymal transition subtypes (P = 0.029). EMT: Epithelial-mesenchymal transition; SOX2: Sex determining region Y-box 2.
- Citation: Li C, Ma YQ. Prognostic significance of sex determining region Y-box 2, E-cadherin, and vimentin in esophageal squamous cell carcinoma. World J Clin Cases 2022; 10(27): 9657-9669
- URL: https://www.wjgnet.com/2307-8960/full/v10/i27/9657.htm
- DOI: https://dx.doi.org/10.12998/wjcc.v10.i27.9657


