Copyright
©The Author(s) 2022.
World J Clin Cases. Sep 16, 2022; 10(26): 9285-9302
Published online Sep 16, 2022. doi: 10.12998/wjcc.v10.i26.9285
Published online Sep 16, 2022. doi: 10.12998/wjcc.v10.i26.9285
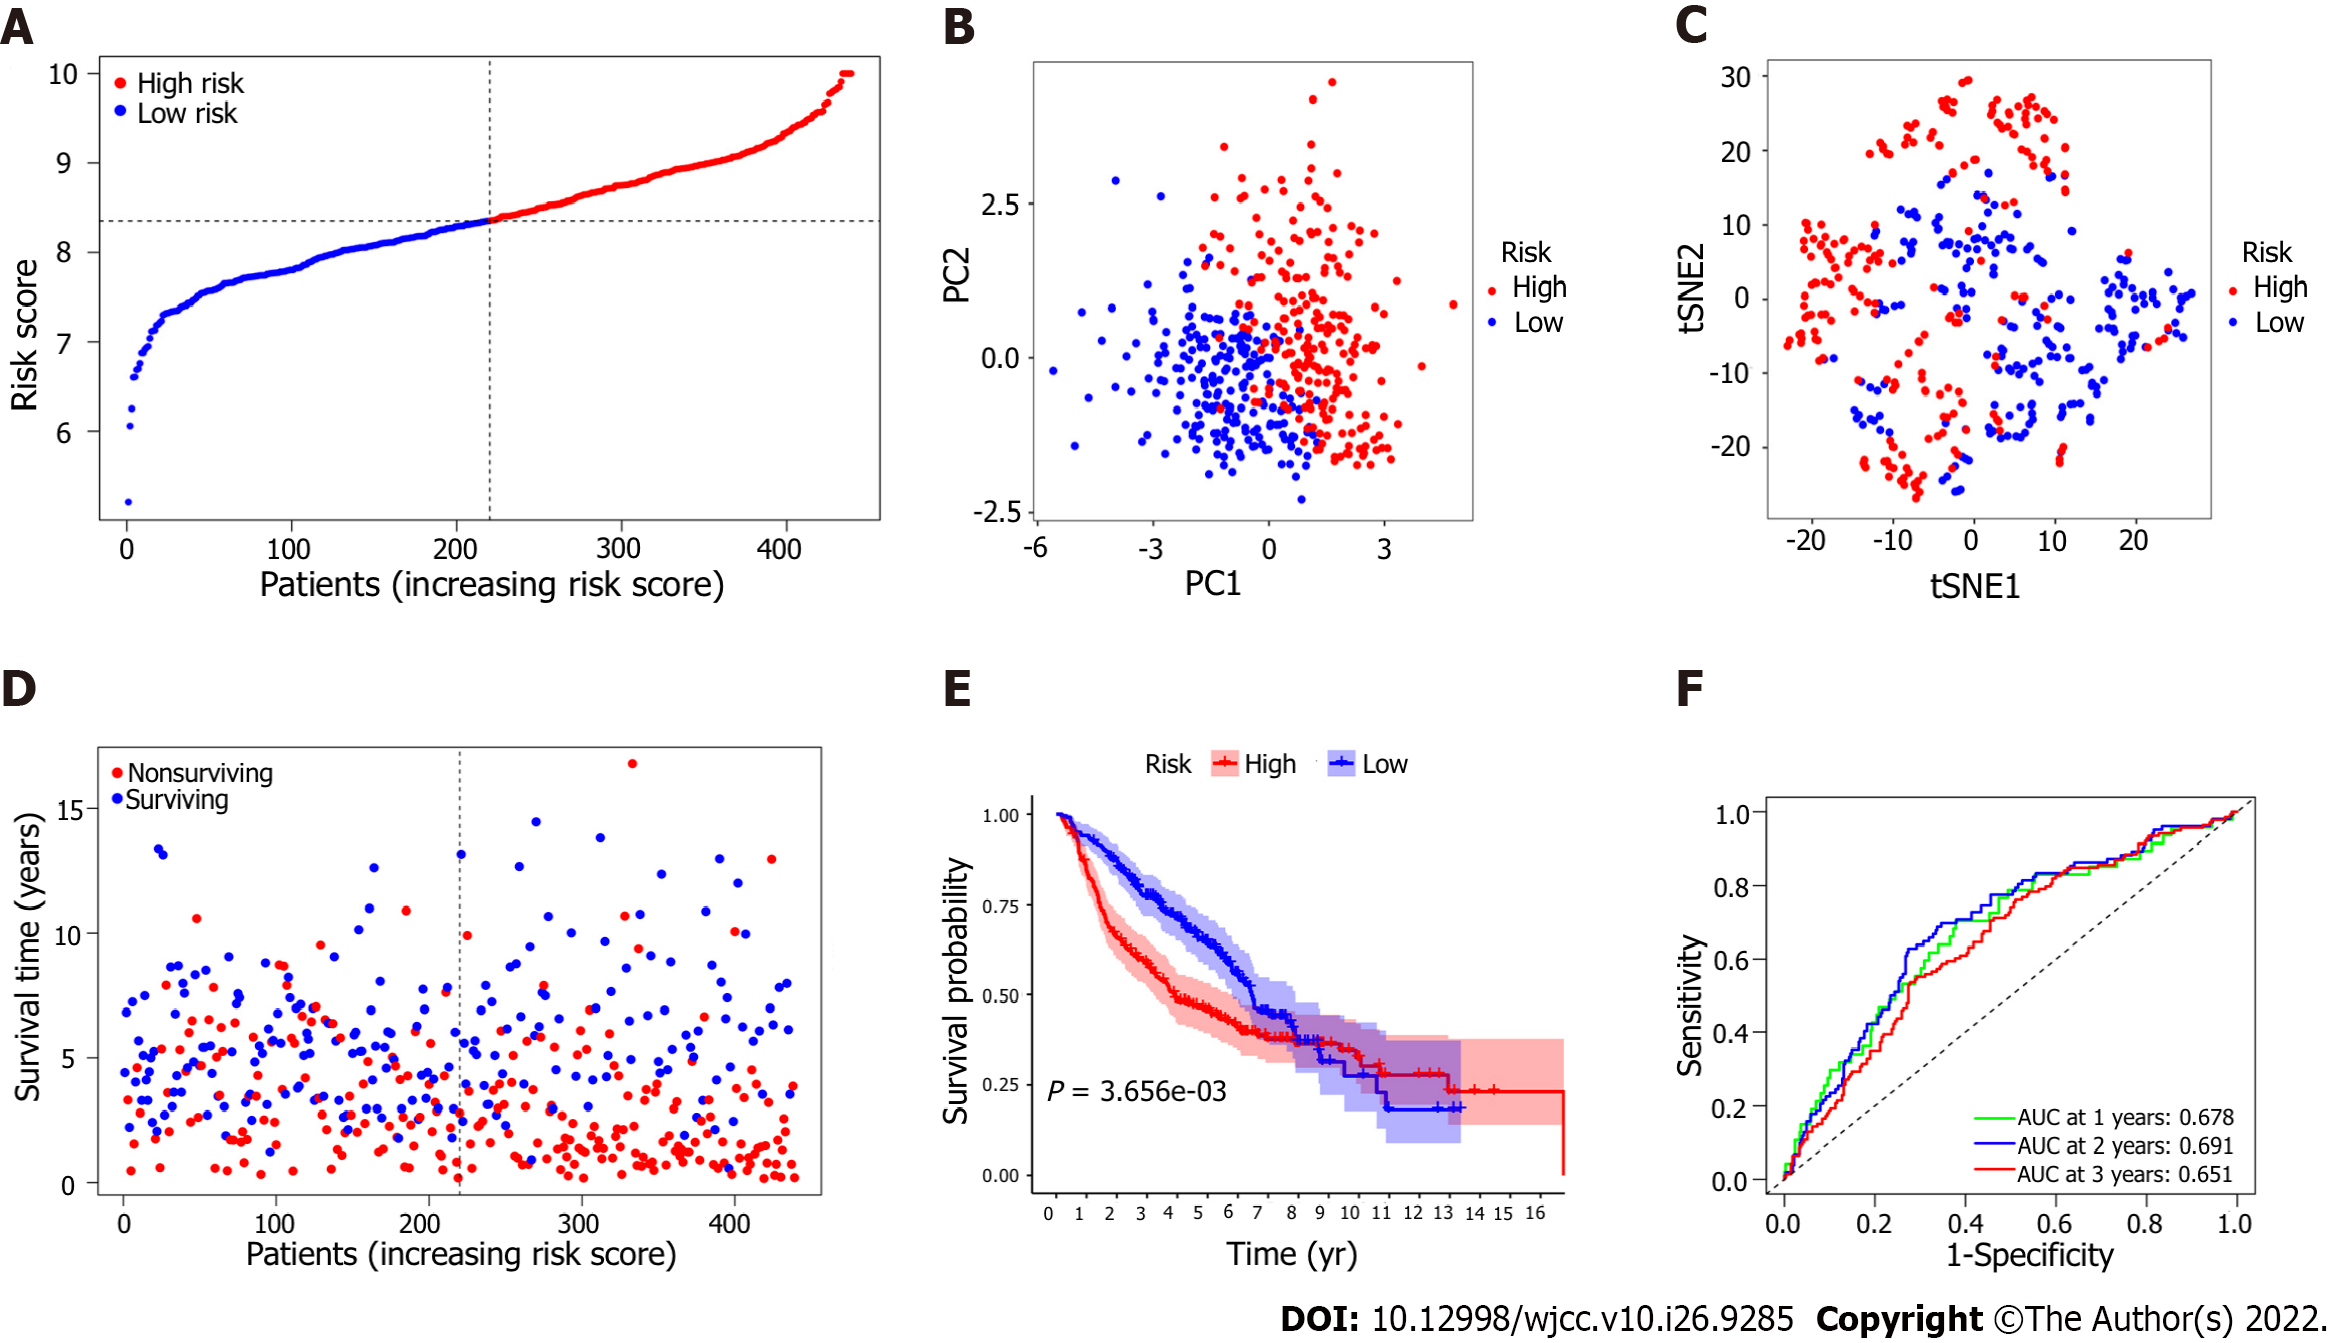
Figure 5 Validation of the 7 epithelial-mesenchymal transition-associated gene signature model in the validation cohort.
A: The median value and distribution of the risk scores in the validation cohort; B: Principal component analysis (PCA) plot; C: Results of t-distributed stochastic neighbor embedding (t-SNE) analysis; D: The distributions of overall survival (OS) status for the high-risk group and the low-risk group; E: Kaplan-Meier analysis of OS for lung adenocarcinoma (LUAD) patients in the high-risk group and the low-risk group; F: The area under the curve (AUC) of the time-dependent receiver operator characteristic curve (ROC) validated the predictive performance of the prognostic risk score in the validation cohort.
- Citation: Zhou DH, Du QC, Fu Z, Wang XY, Zhou L, Wang J, Hu CK, Liu S, Li JM, Ma ML, Yu H. Development and validation of an epithelial–mesenchymal transition-related gene signature for predicting prognosis. World J Clin Cases 2022; 10(26): 9285-9302
- URL: https://www.wjgnet.com/2307-8960/full/v10/i26/9285.htm
- DOI: https://dx.doi.org/10.12998/wjcc.v10.i26.9285


