Copyright
©The Author(s) 2022.
World J Clin Cases. Sep 6, 2022; 10(25): 9132-9141
Published online Sep 6, 2022. doi: 10.12998/wjcc.v10.i25.9132
Published online Sep 6, 2022. doi: 10.12998/wjcc.v10.i25.9132
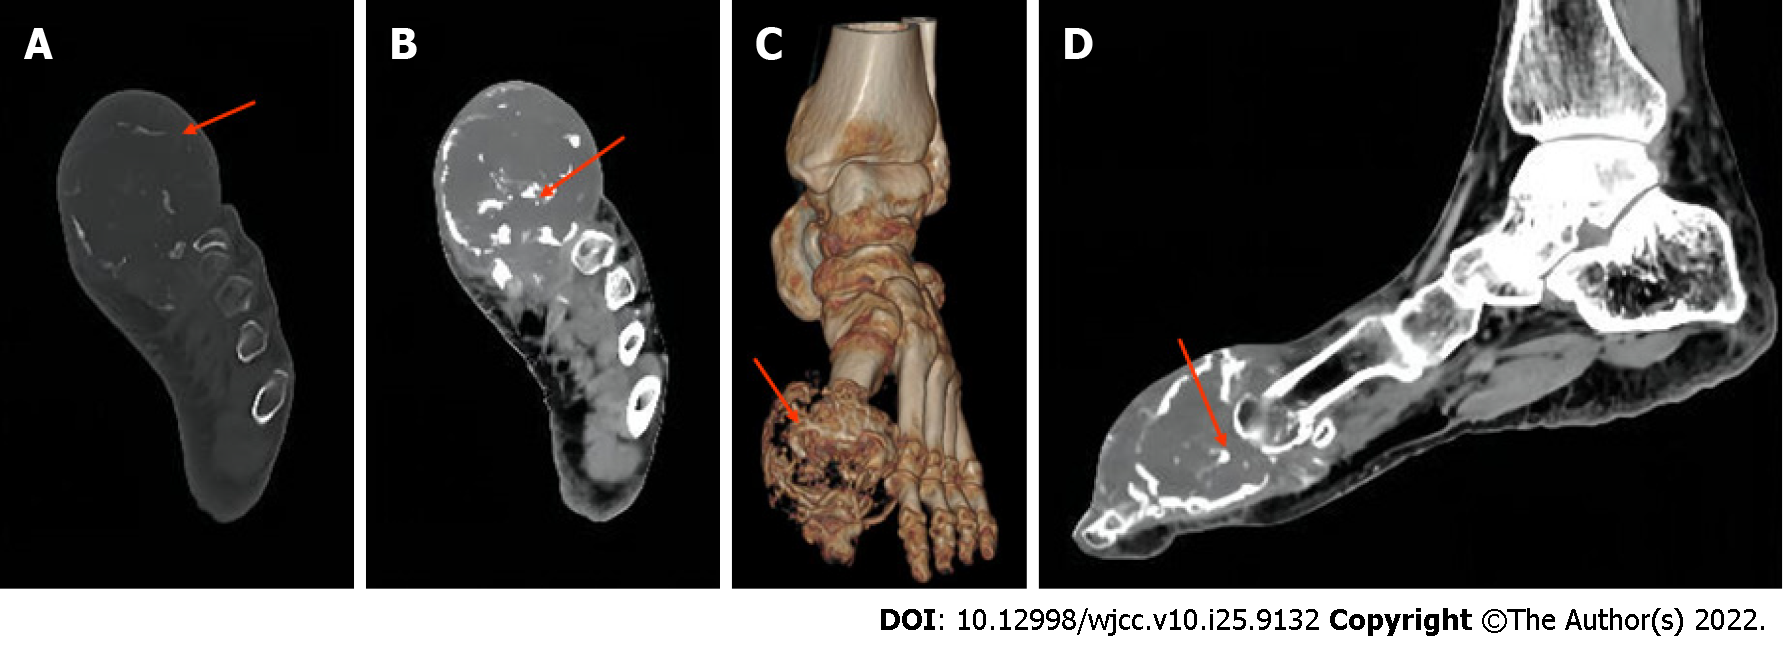
Figure 1 Computed tomography imaging of chondrosarcoma of the toe.
A: Osteochondrosarcoma of the first phalanx of the left foot (arrow) [computed tomography (CT) axial bone window] shows osteolytic destruction of the distal bone of this phalanx; B: Osteochondrosarcoma of the first phalanx of the left foot (arrow) (CT axial soft tissue window) shows the longest diameter of the local soft tissue mass with speckled bony hyperintensity; C: Osteochondrosarcoma of the first phalanx of the left foot (arrow) (CT 3D view) showing osteolytic destruction of the distal bone of this phalanx; D: Osteochondrosarcoma of the first phalanx of the left foot (arrow) (CT sagittal soft tissue window) shows the widest diameter of the local soft tissue mass and the relationship of the lesion to the adjacent phalanx with a speckled bony hyperdense shadow.
- Citation: Zhou LB, Zhang HC, Dong ZG, Wang CC. Chondrosarcoma of the toe: A case report and literature review. World J Clin Cases 2022; 10(25): 9132-9141
- URL: https://www.wjgnet.com/2307-8960/full/v10/i25/9132.htm
- DOI: https://dx.doi.org/10.12998/wjcc.v10.i25.9132


