Copyright
©The Author(s) 2022.
World J Clin Cases. Sep 6, 2022; 10(25): 9012-9019
Published online Sep 6, 2022. doi: 10.12998/wjcc.v10.i25.9012
Published online Sep 6, 2022. doi: 10.12998/wjcc.v10.i25.9012
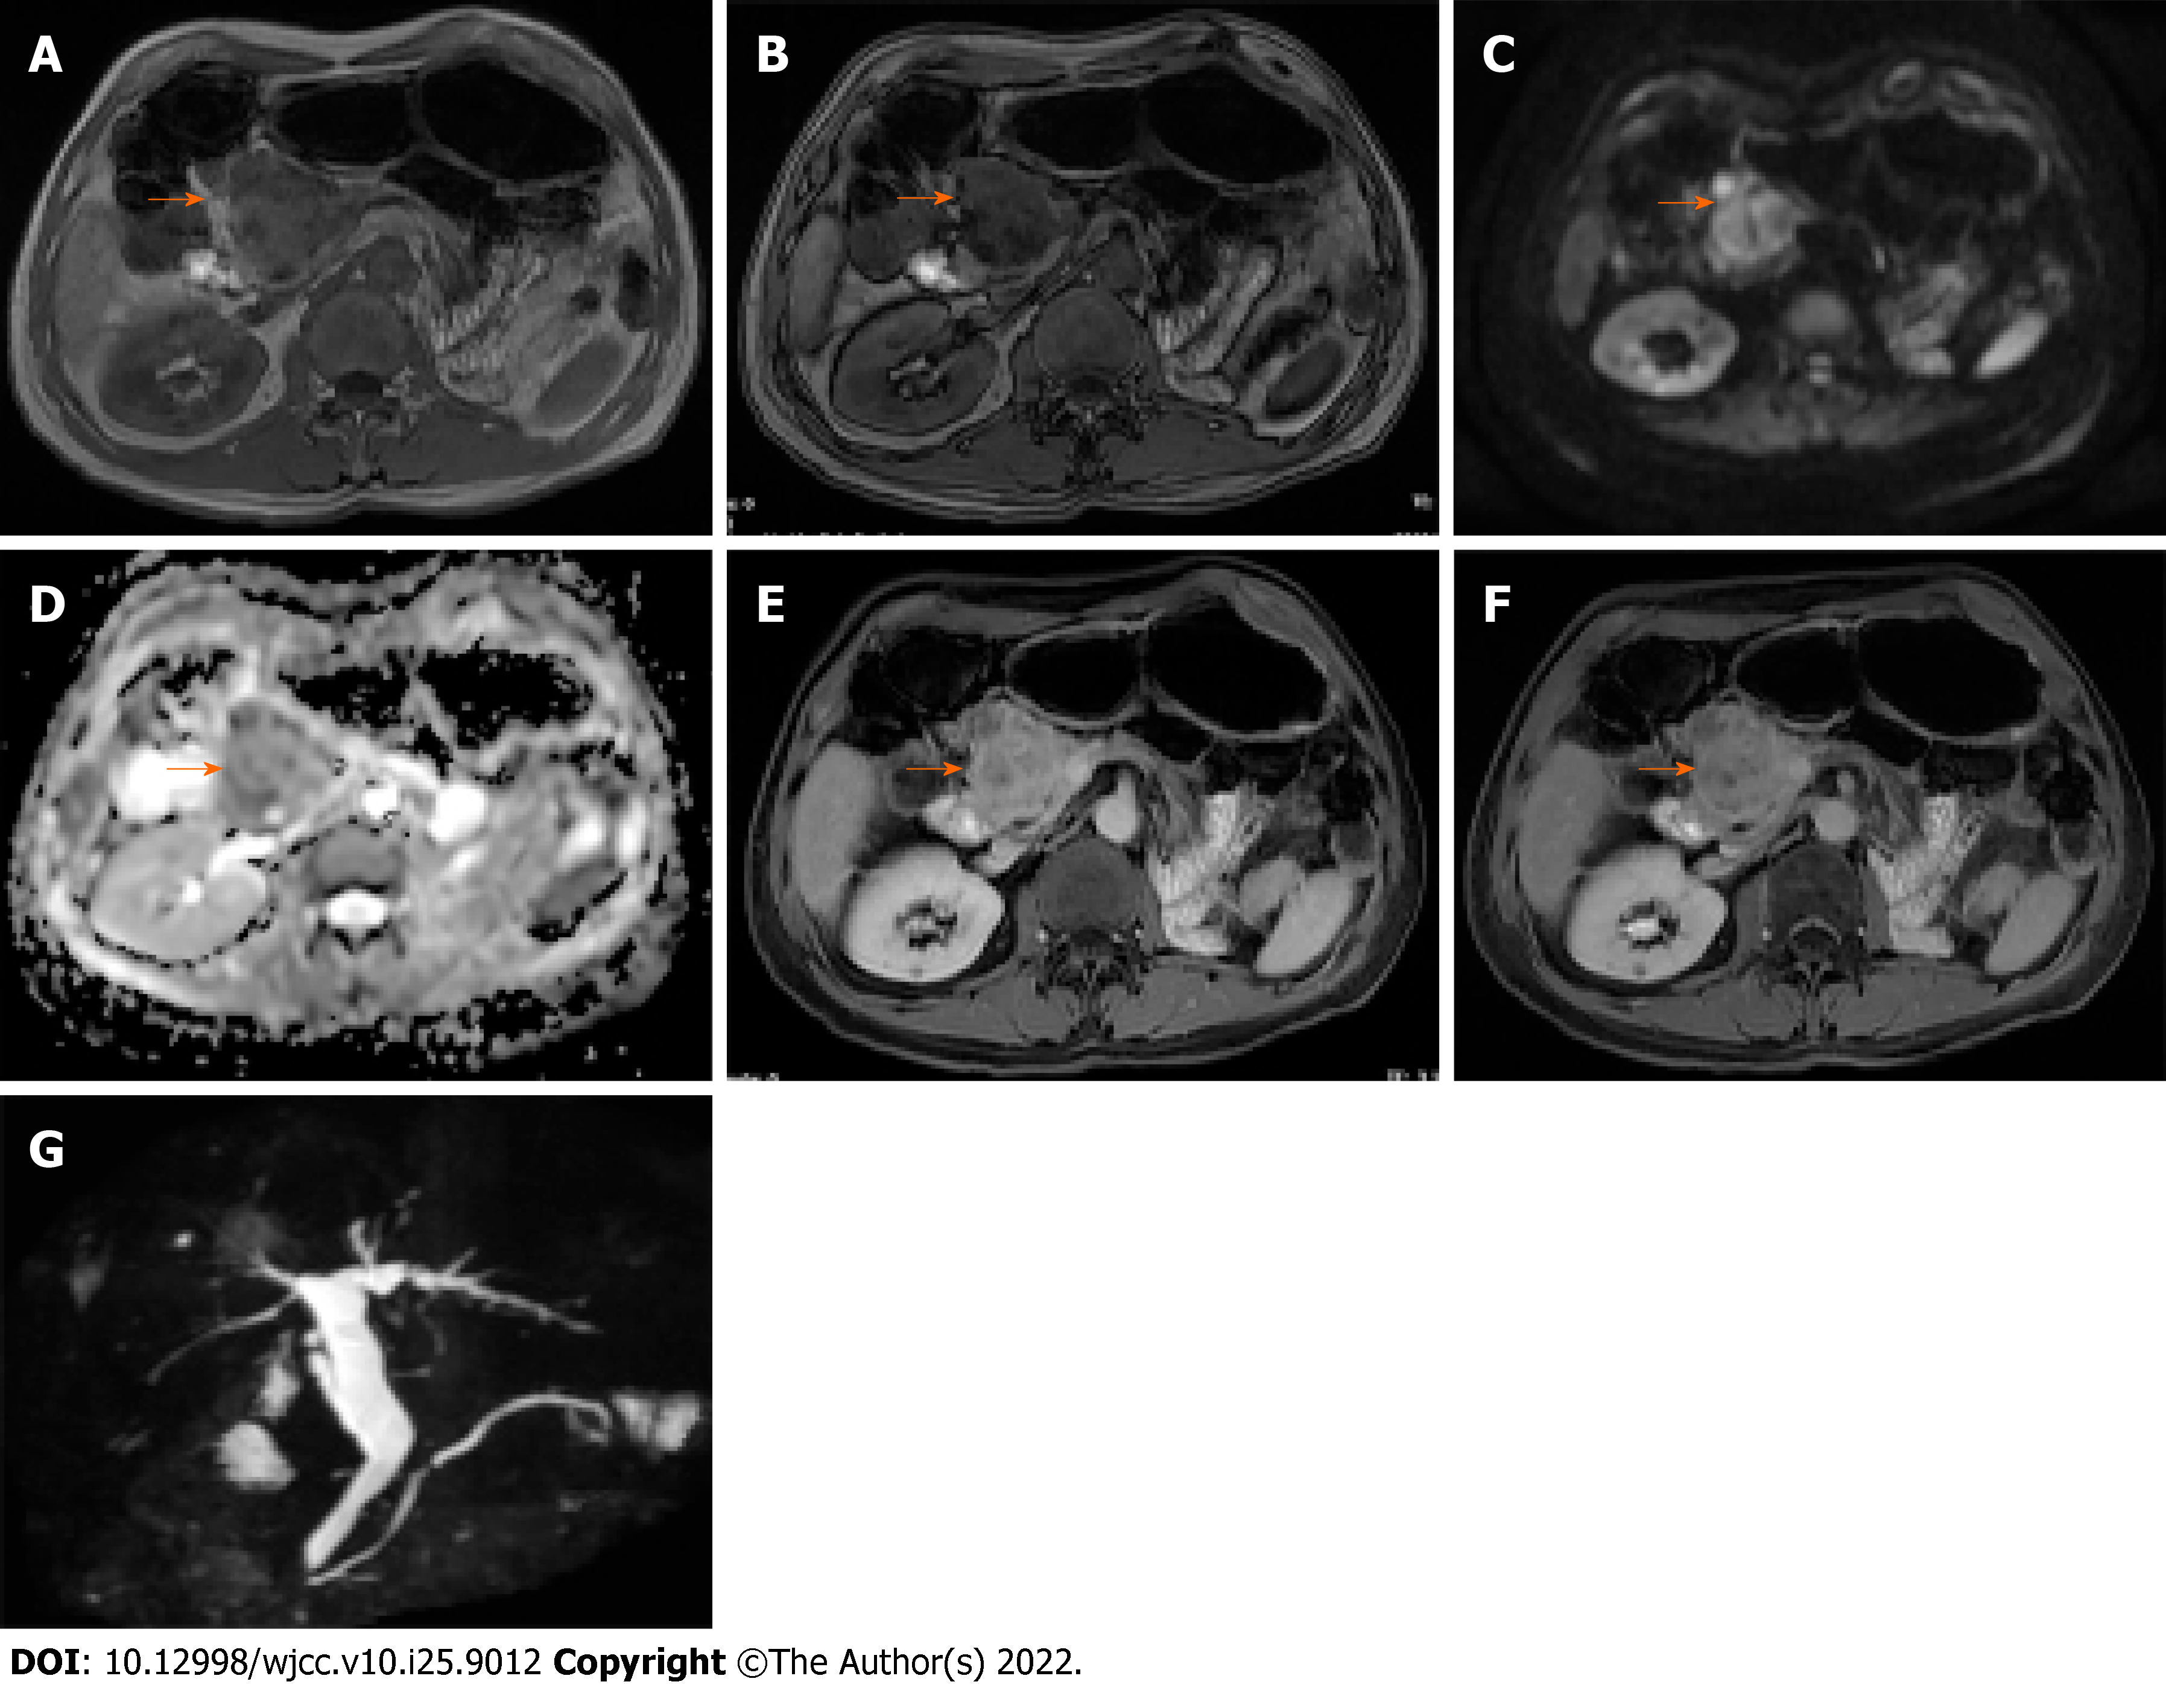
Figure 3 Abdominal magnetic resonance imaging.
A: T1W in-phase; B: out-of-phase images show a well-defined mass (arrow) in the pancreatic head, with signal loss on out-of-phase images for intracellular fat (arrow); C: Diffusion-weighted image (b 800 s/mm2); D: Increased signal (arrow), with a corresponding low signal on the apparent diffusion coefficient map; E and F: T1W FS contrast-enhanced images show marked heterogeneous enhancement in the arterial phase, with wash out in venous phase (though the thin hyperintense rim persists); and G: Magnetic resonance cholangiogram shows a dilated common bile duct and main pancreatic duct.
- Citation: Liang XK, Li LJ, He YM, Xu ZF. Misdiagnosis of pancreatic metastasis from renal cell carcinoma: A case report. World J Clin Cases 2022; 10(25): 9012-9019
- URL: https://www.wjgnet.com/2307-8960/full/v10/i25/9012.htm
- DOI: https://dx.doi.org/10.12998/wjcc.v10.i25.9012


