Copyright
©The Author(s) 2022.
World J Clin Cases. Aug 26, 2022; 10(24): 8568-8577
Published online Aug 26, 2022. doi: 10.12998/wjcc.v10.i24.8568
Published online Aug 26, 2022. doi: 10.12998/wjcc.v10.i24.8568
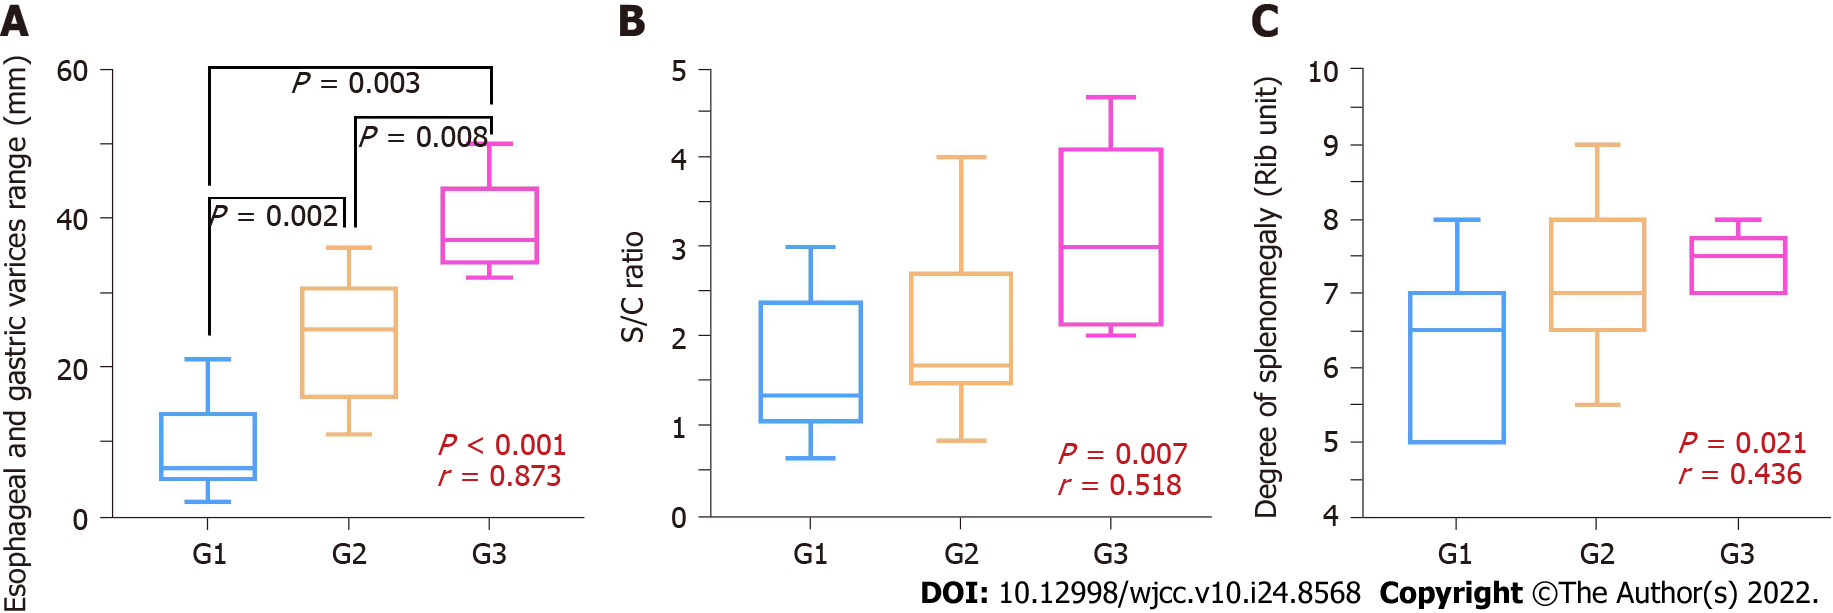
Figure 2 Box diagram of each parameter graded by gastroscopy.
A: Varicose vein range (mm); B: S/C ratio; C: Spleen size (number of rib units).
- Citation: Wang YL, Zhang HW, Lin F. Computed tomography combined with gastroscopy for assessment of pancreatic segmental portal hypertension. World J Clin Cases 2022; 10(24): 8568-8577
- URL: https://www.wjgnet.com/2307-8960/full/v10/i24/8568.htm
- DOI: https://dx.doi.org/10.12998/wjcc.v10.i24.8568


