Copyright
©The Author(s) 2022.
World J Clin Cases. Aug 26, 2022; 10(24): 8490-8505
Published online Aug 26, 2022. doi: 10.12998/wjcc.v10.i24.8490
Published online Aug 26, 2022. doi: 10.12998/wjcc.v10.i24.8490
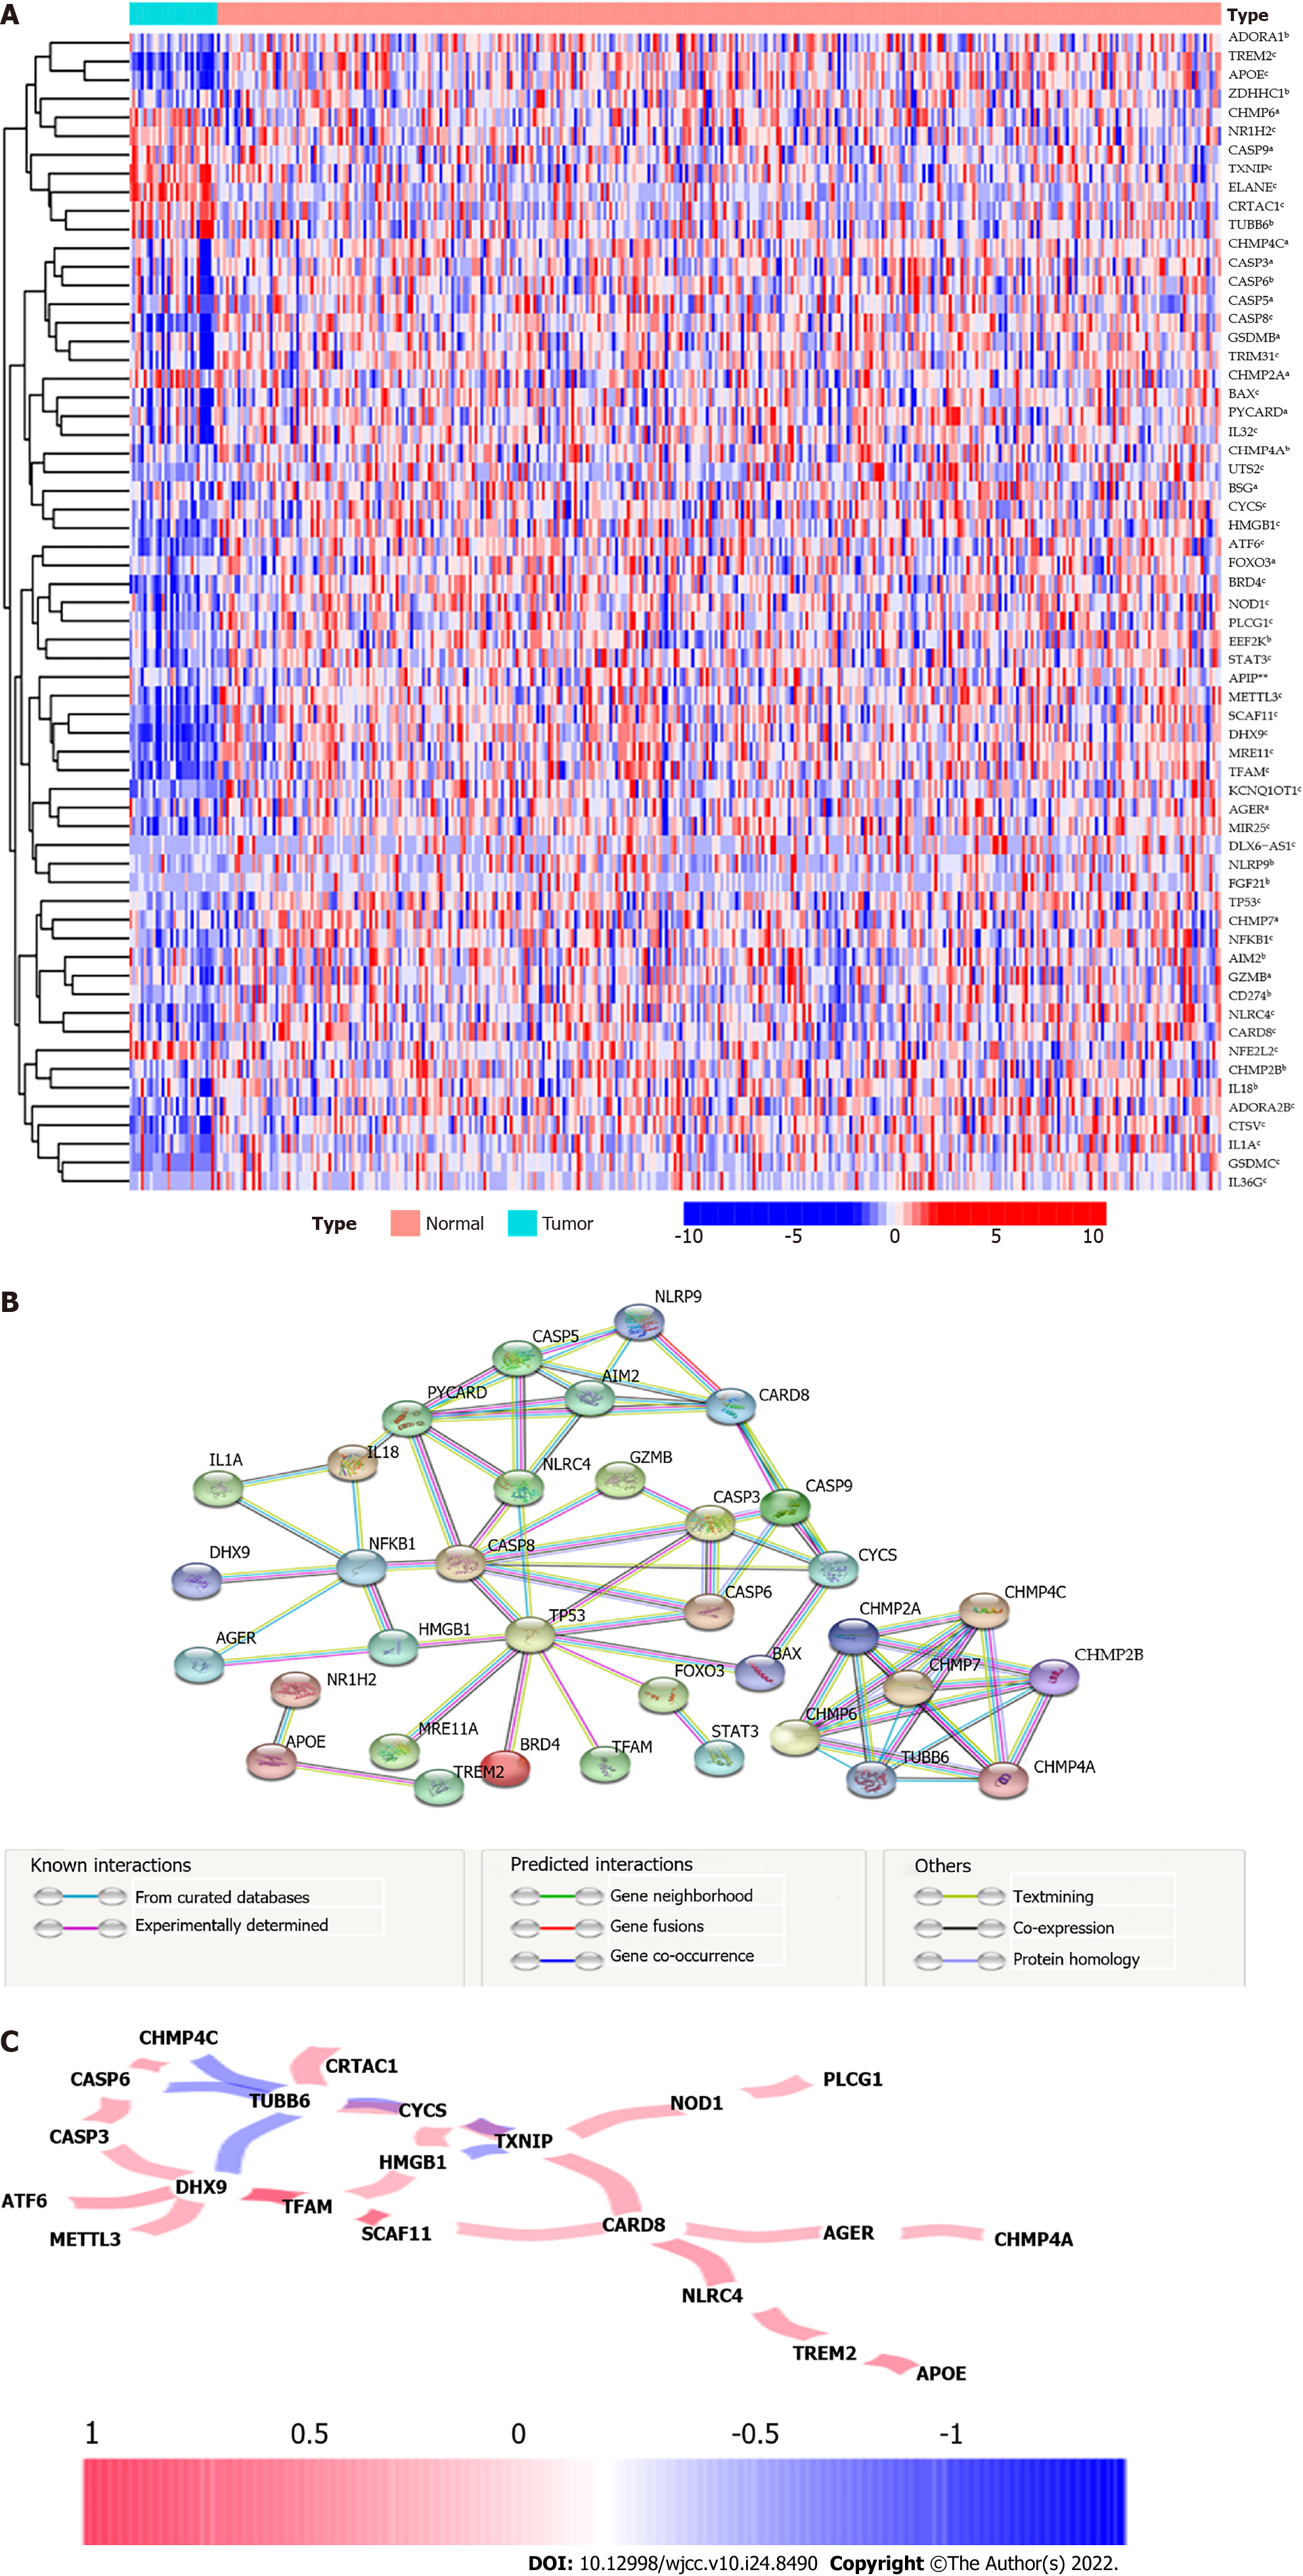
Figure 2 Interaction among 199 pyroptosis-related genes.
A: Heatmap (blue: low expression level; red: high expression level) of the pyroptosis-related genes between the adjacent nontumor tissues (brilliant blue) and the tumor tissues (red). P values were showed as: aP < 0.05, bP < 0.01, and cP < 0.001; B: Protein–protein interaction network reflecting the interactions of the differentially expressed genes (DEGs); C: The correlation network of DEGs. The correlation coefficients are represented by different colors. Red line: Positive correlation; Blue line: Negative correlation. The depth of the colors indicates the strength of the relevance.
- Citation: Guan SH, Wang XY, Shang P, Du QC, Li MZ, Xing X, Yan B. Pyroptosis-related genes play a significant role in the prognosis of gastric cancer. World J Clin Cases 2022; 10(24): 8490-8505
- URL: https://www.wjgnet.com/2307-8960/full/v10/i24/8490.htm
- DOI: https://dx.doi.org/10.12998/wjcc.v10.i24.8490


