Copyright
©The Author(s) 2022.
World J Clin Cases. Aug 6, 2022; 10(22): 8009-8017
Published online Aug 6, 2022. doi: 10.12998/wjcc.v10.i22.8009
Published online Aug 6, 2022. doi: 10.12998/wjcc.v10.i22.8009
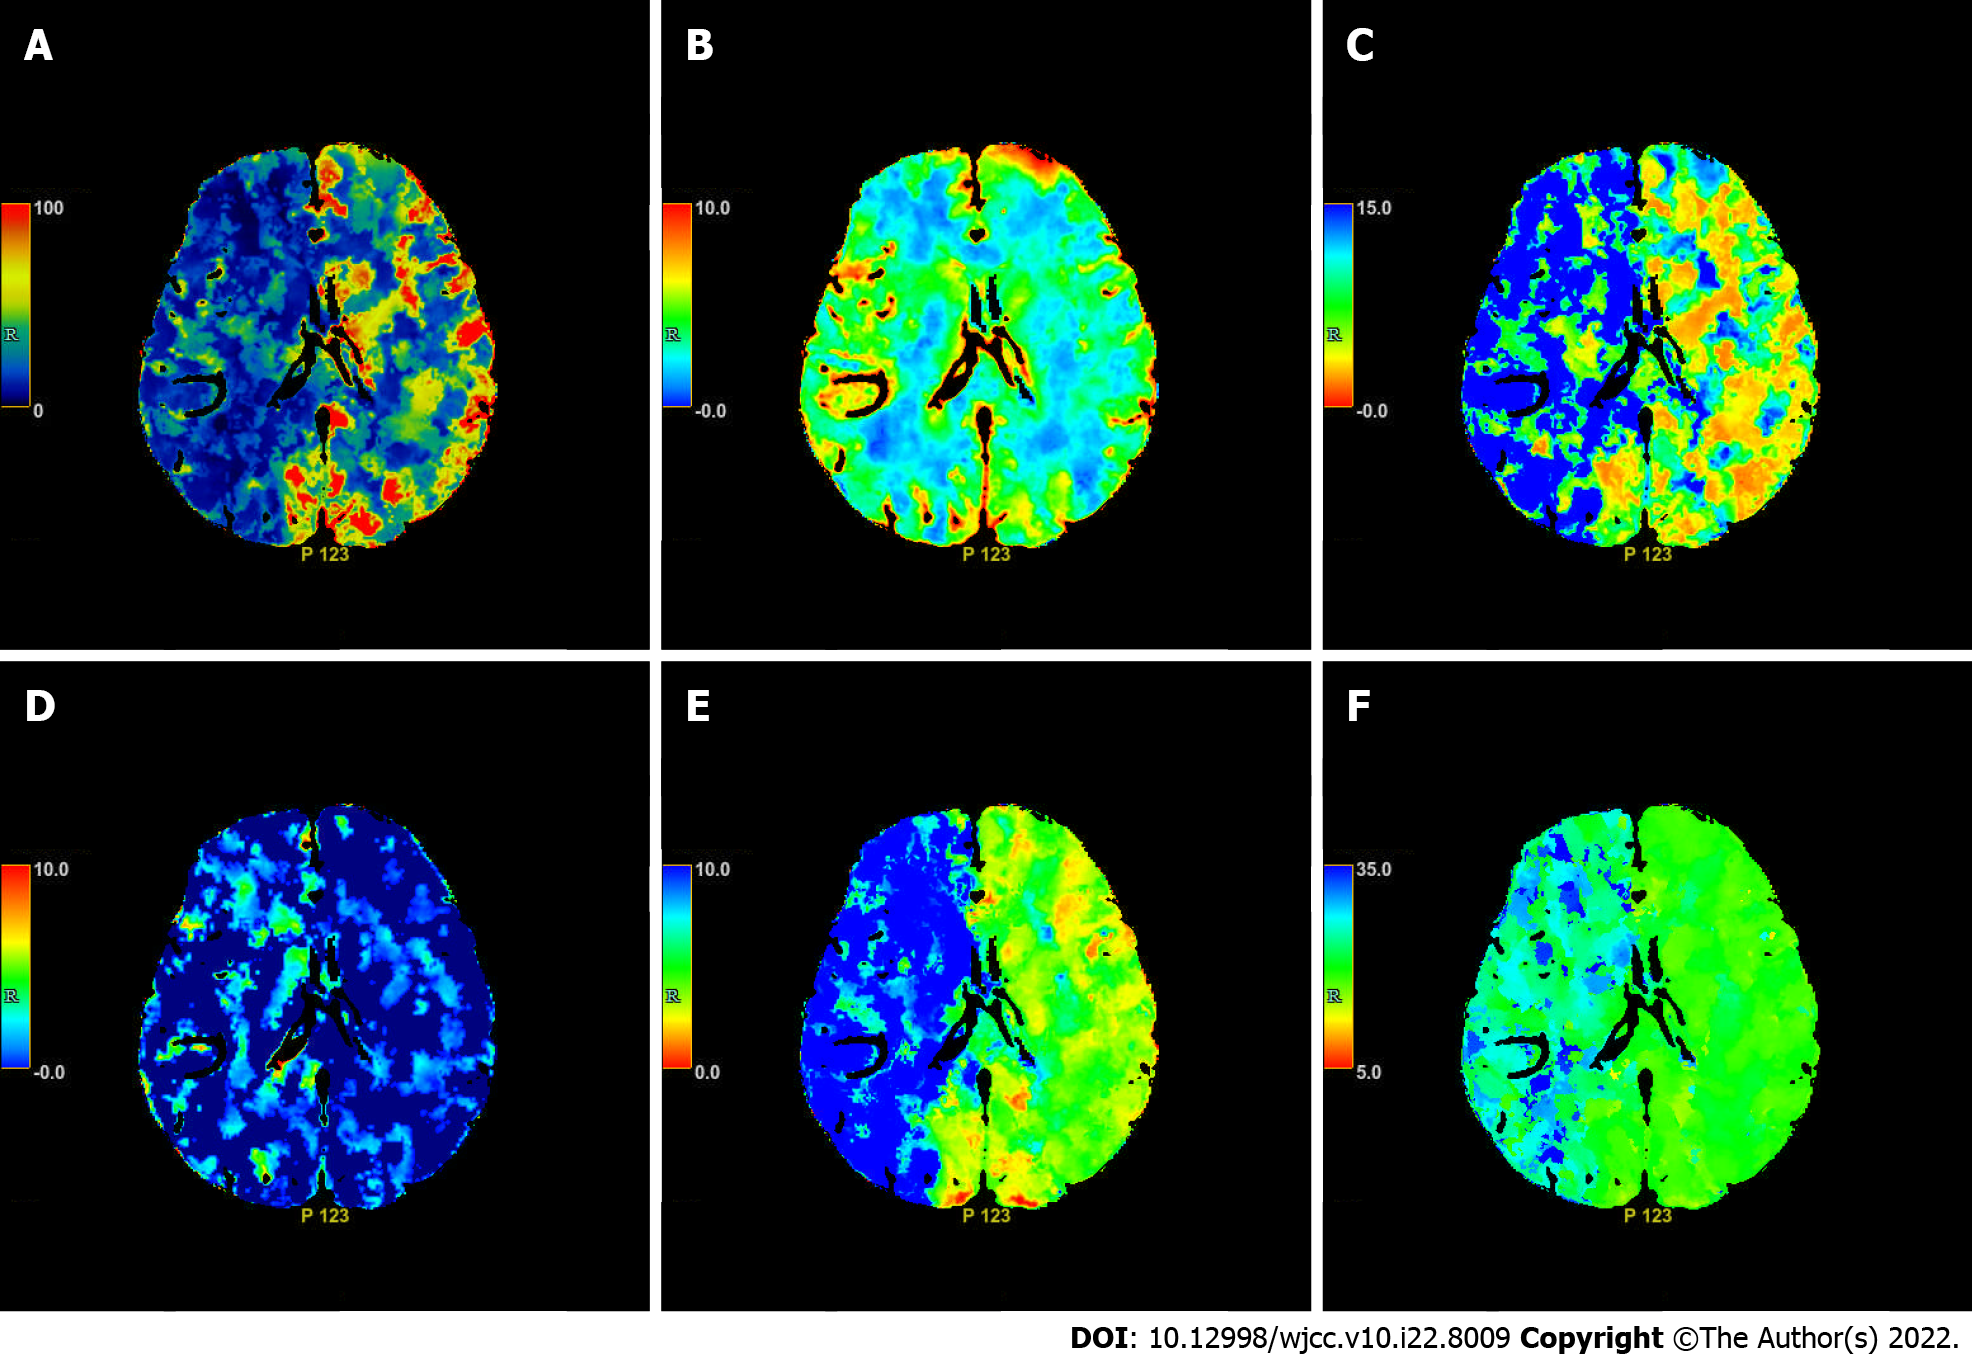
Figure 3 Axial computed tomography perfusion images on the second day of intravenous thrombolysis.
Cerebral blood flow (A), cerebral blood volume (B), mean transit time (C), PS (D), Tmax (E) and Time to peak (F) show multiple ischemic cores in the right frontotemporoparietal lobe as well as relatively extensive hypoperfusion area.
- Citation: He ZY, Yao LP, Wang XK, Chen NY, Zhao JJ, Zhou Q, Yang XF. Acute ischemic Stroke combined with Stanford type A aortic dissection: A case report and literature review. World J Clin Cases 2022; 10(22): 8009-8017
- URL: https://www.wjgnet.com/2307-8960/full/v10/i22/8009.htm
- DOI: https://dx.doi.org/10.12998/wjcc.v10.i22.8009


