Copyright
©The Author(s) 2022.
World J Clin Cases. Aug 6, 2022; 10(22): 7872-7882
Published online Aug 6, 2022. doi: 10.12998/wjcc.v10.i22.7872
Published online Aug 6, 2022. doi: 10.12998/wjcc.v10.i22.7872
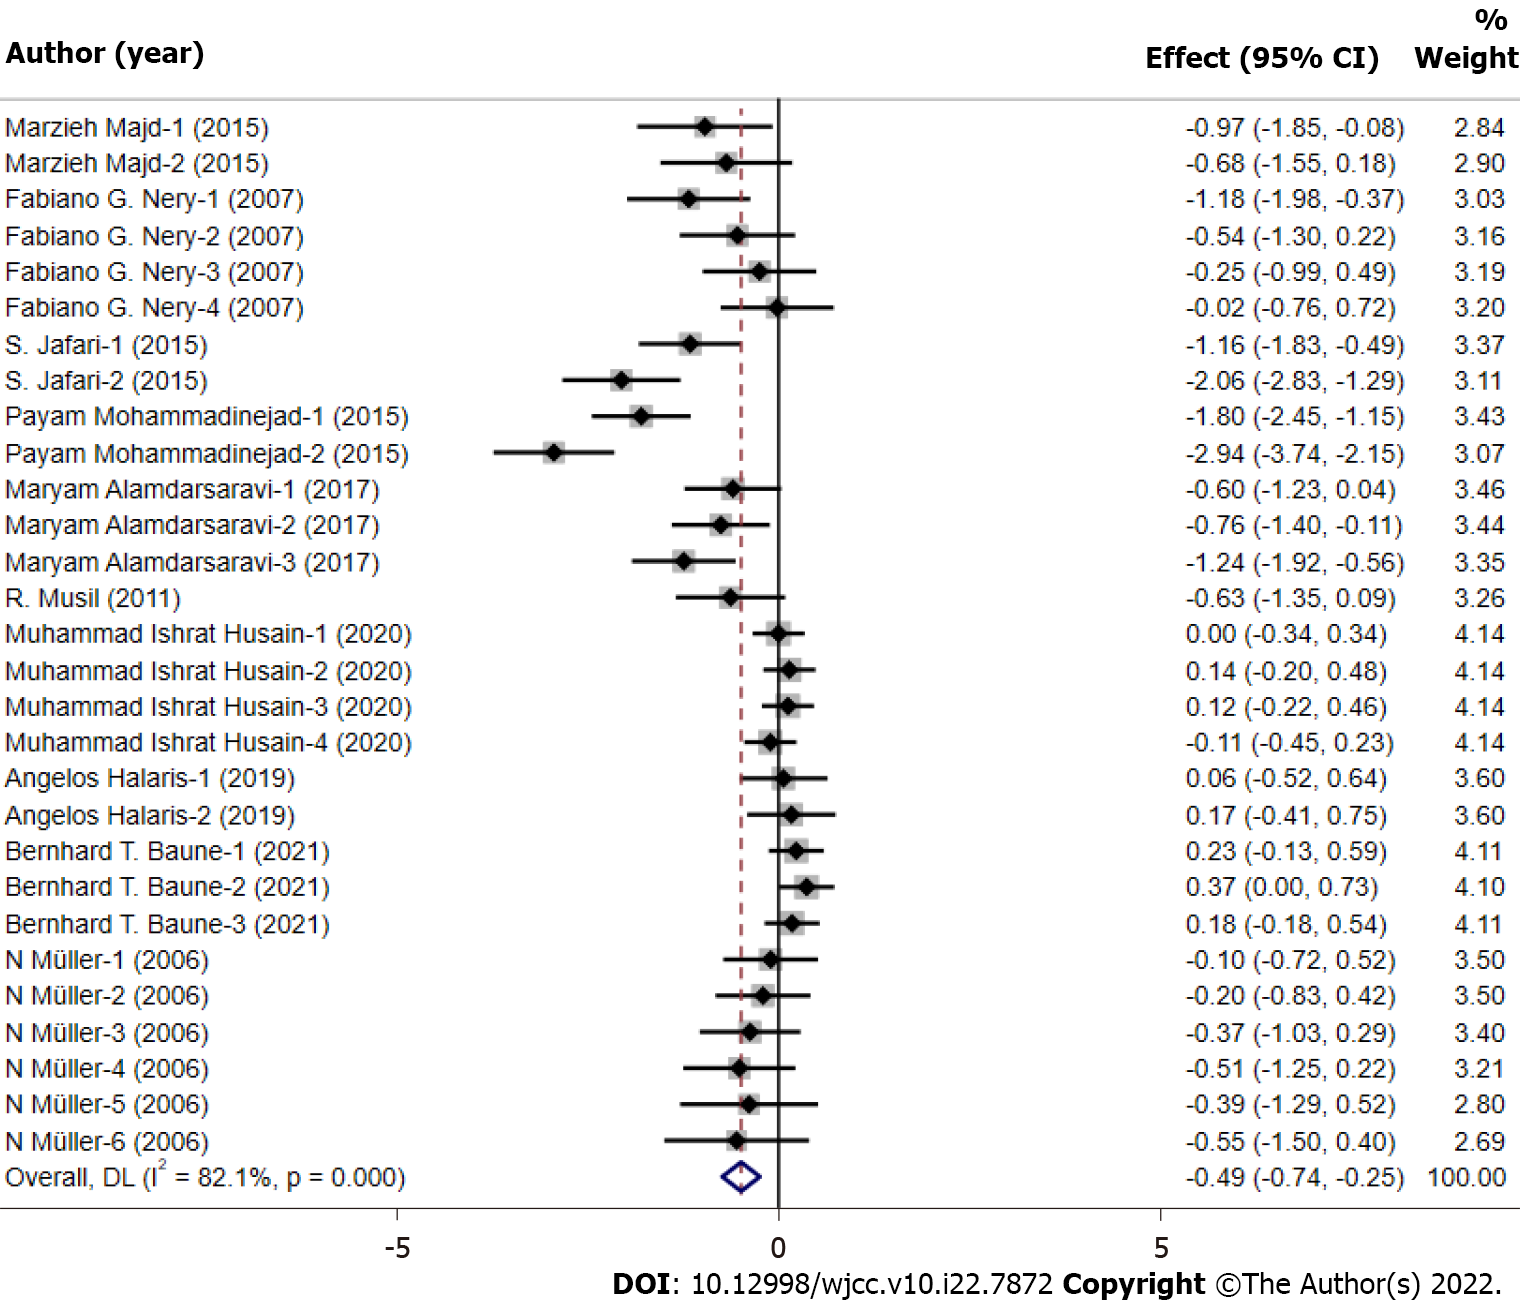
Figure 3 The pooled quantitative synthesis for depression scores in the celecoxib group and control group.
Twenty-nine studies were included in the meta-analysis. With the random effect model, the depression scores were calculated through using standardized mean differences (grey squares with small black squares) with 95%CIs (horizontal lines through gray squares) and pooled-effect sizes (blue diamonds).
- Citation: Wang Z, Wu Q, Wang Q. Effect of celecoxib on improving depression: A systematic review and meta-analysis. World J Clin Cases 2022; 10(22): 7872-7882
- URL: https://www.wjgnet.com/2307-8960/full/v10/i22/7872.htm
- DOI: https://dx.doi.org/10.12998/wjcc.v10.i22.7872


