Copyright
©The Author(s) 2022.
World J Clin Cases. Aug 6, 2022; 10(22): 7772-7784
Published online Aug 6, 2022. doi: 10.12998/wjcc.v10.i22.7772
Published online Aug 6, 2022. doi: 10.12998/wjcc.v10.i22.7772
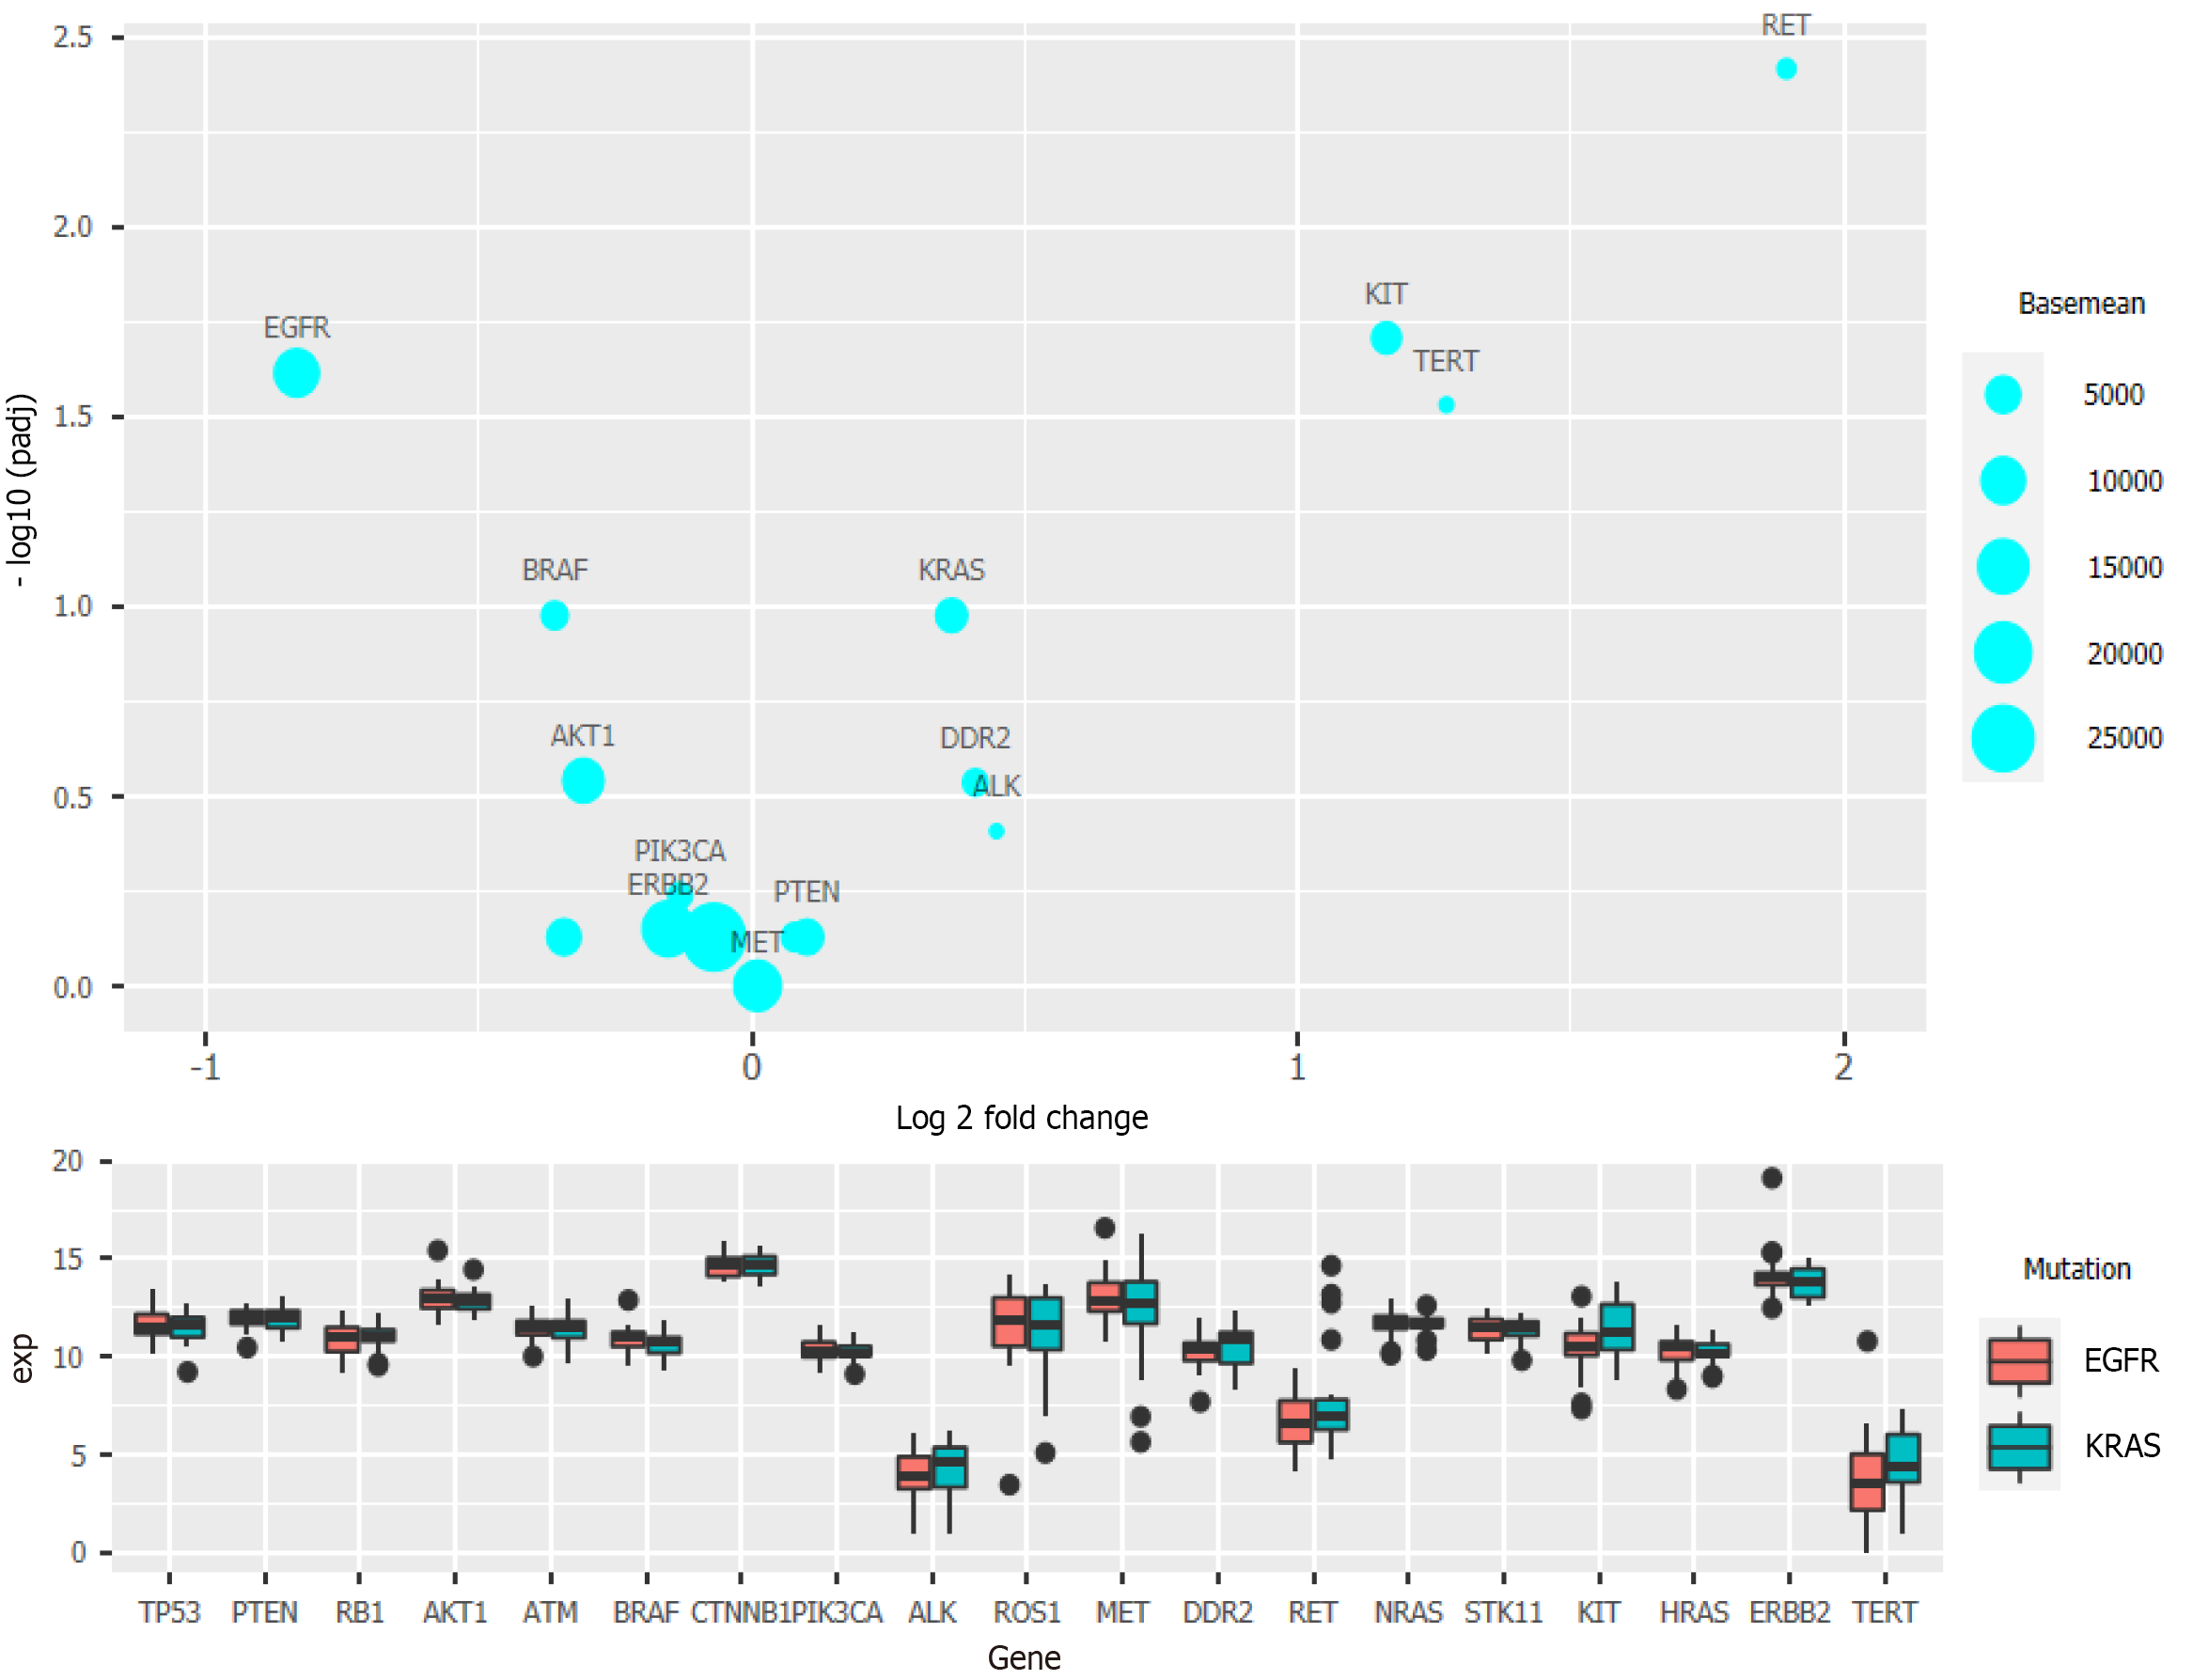
Figure 3 Bubble chart and box chart show that RET, KIT, and TERT exhibit significantly different expression levels between the two groups.
The samples were grouped based on the epidermal growth factor receptor and KRAS mutation status with more than 20 samples in each group.
- Citation: Yan LD, Yang L, Li N, Wang M, Zhang YH, Zhou W, Yu ZQ, Peng XC, Cai J. Prognostic role of multiple abnormal genes in non-small-cell lung cancer. World J Clin Cases 2022; 10(22): 7772-7784
- URL: https://www.wjgnet.com/2307-8960/full/v10/i22/7772.htm
- DOI: https://dx.doi.org/10.12998/wjcc.v10.i22.7772


