Copyright
©The Author(s) 2022.
World J Clin Cases. Aug 6, 2022; 10(22): 7686-7697
Published online Aug 6, 2022. doi: 10.12998/wjcc.v10.i22.7686
Published online Aug 6, 2022. doi: 10.12998/wjcc.v10.i22.7686
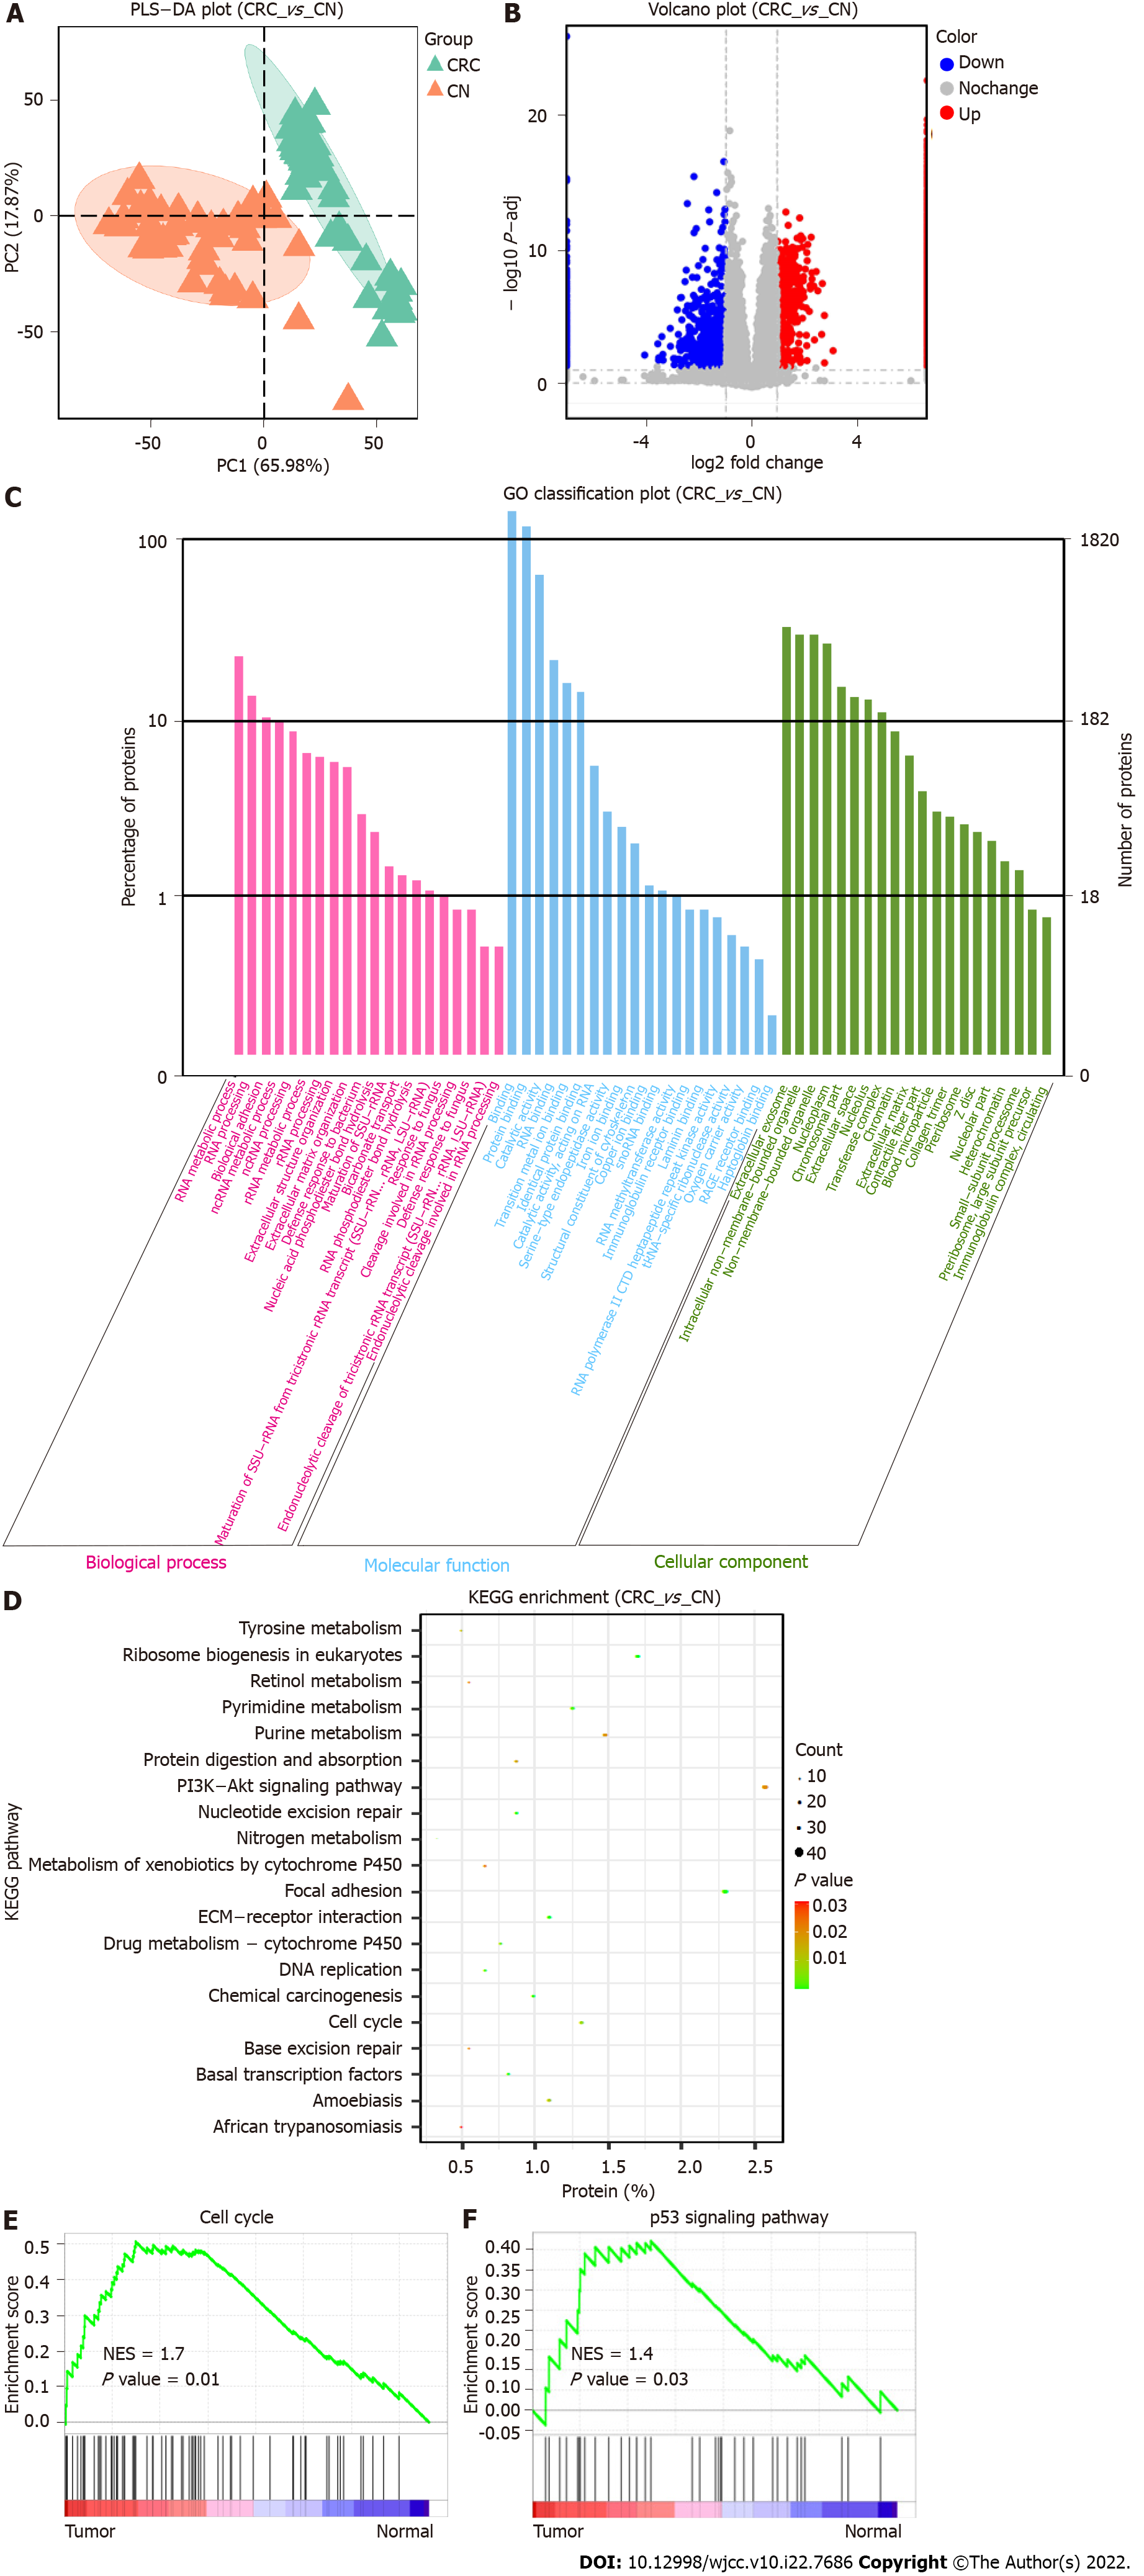
Figure 1 Quantitative proteomic profiling and bioinformatic analysis of colorectal cancer.
A: Partial least squares-discriminant analysis of colorectal cancer and normal tissues; B: The volcano plot shows 1115 upregulated and 705 downregulated proteins in tumors; C: Gene ontology analysis shows that differentially expressed proteins are involved in biological processes, cellular components, and molecular functions; D: Kyoto encyclopedia of genes and genomes analysis shows that differentially expressed proteins are significantly enriched in multiple pathways including ribosome biogenesis in eukaryotes, focal adhesion, cell cycle and extracellular matrix-receptor interaction; E and F: Gene set enrichment analysis shows that differentially expressed proteins are enriched in the cell cycle and p53 signaling pathway. PLS-DA: Partial least squares-discriminant analysis; CRC: Colorectal cancer tissue; CN: Normal colon tissue; GO: Gene ontology; KEGG: Kyoto encyclopedia of genes and genomes; ECM: Extracellular matrix; NES: Normalized enrichment score.
- Citation: Wang QQ, Zhou YC, Zhou Ge YJ, Qin G, Yin TF, Zhao DY, Tan C, Yao SK. Comprehensive proteomic signature and identification of CDKN2A as a promising prognostic biomarker and therapeutic target of colorectal cancer. World J Clin Cases 2022; 10(22): 7686-7697
- URL: https://www.wjgnet.com/2307-8960/full/v10/i22/7686.htm
- DOI: https://dx.doi.org/10.12998/wjcc.v10.i22.7686


