Copyright
©The Author(s) 2022.
World J Clin Cases. Jul 26, 2022; 10(21): 7585-7591
Published online Jul 26, 2022. doi: 10.12998/wjcc.v10.i21.7585
Published online Jul 26, 2022. doi: 10.12998/wjcc.v10.i21.7585
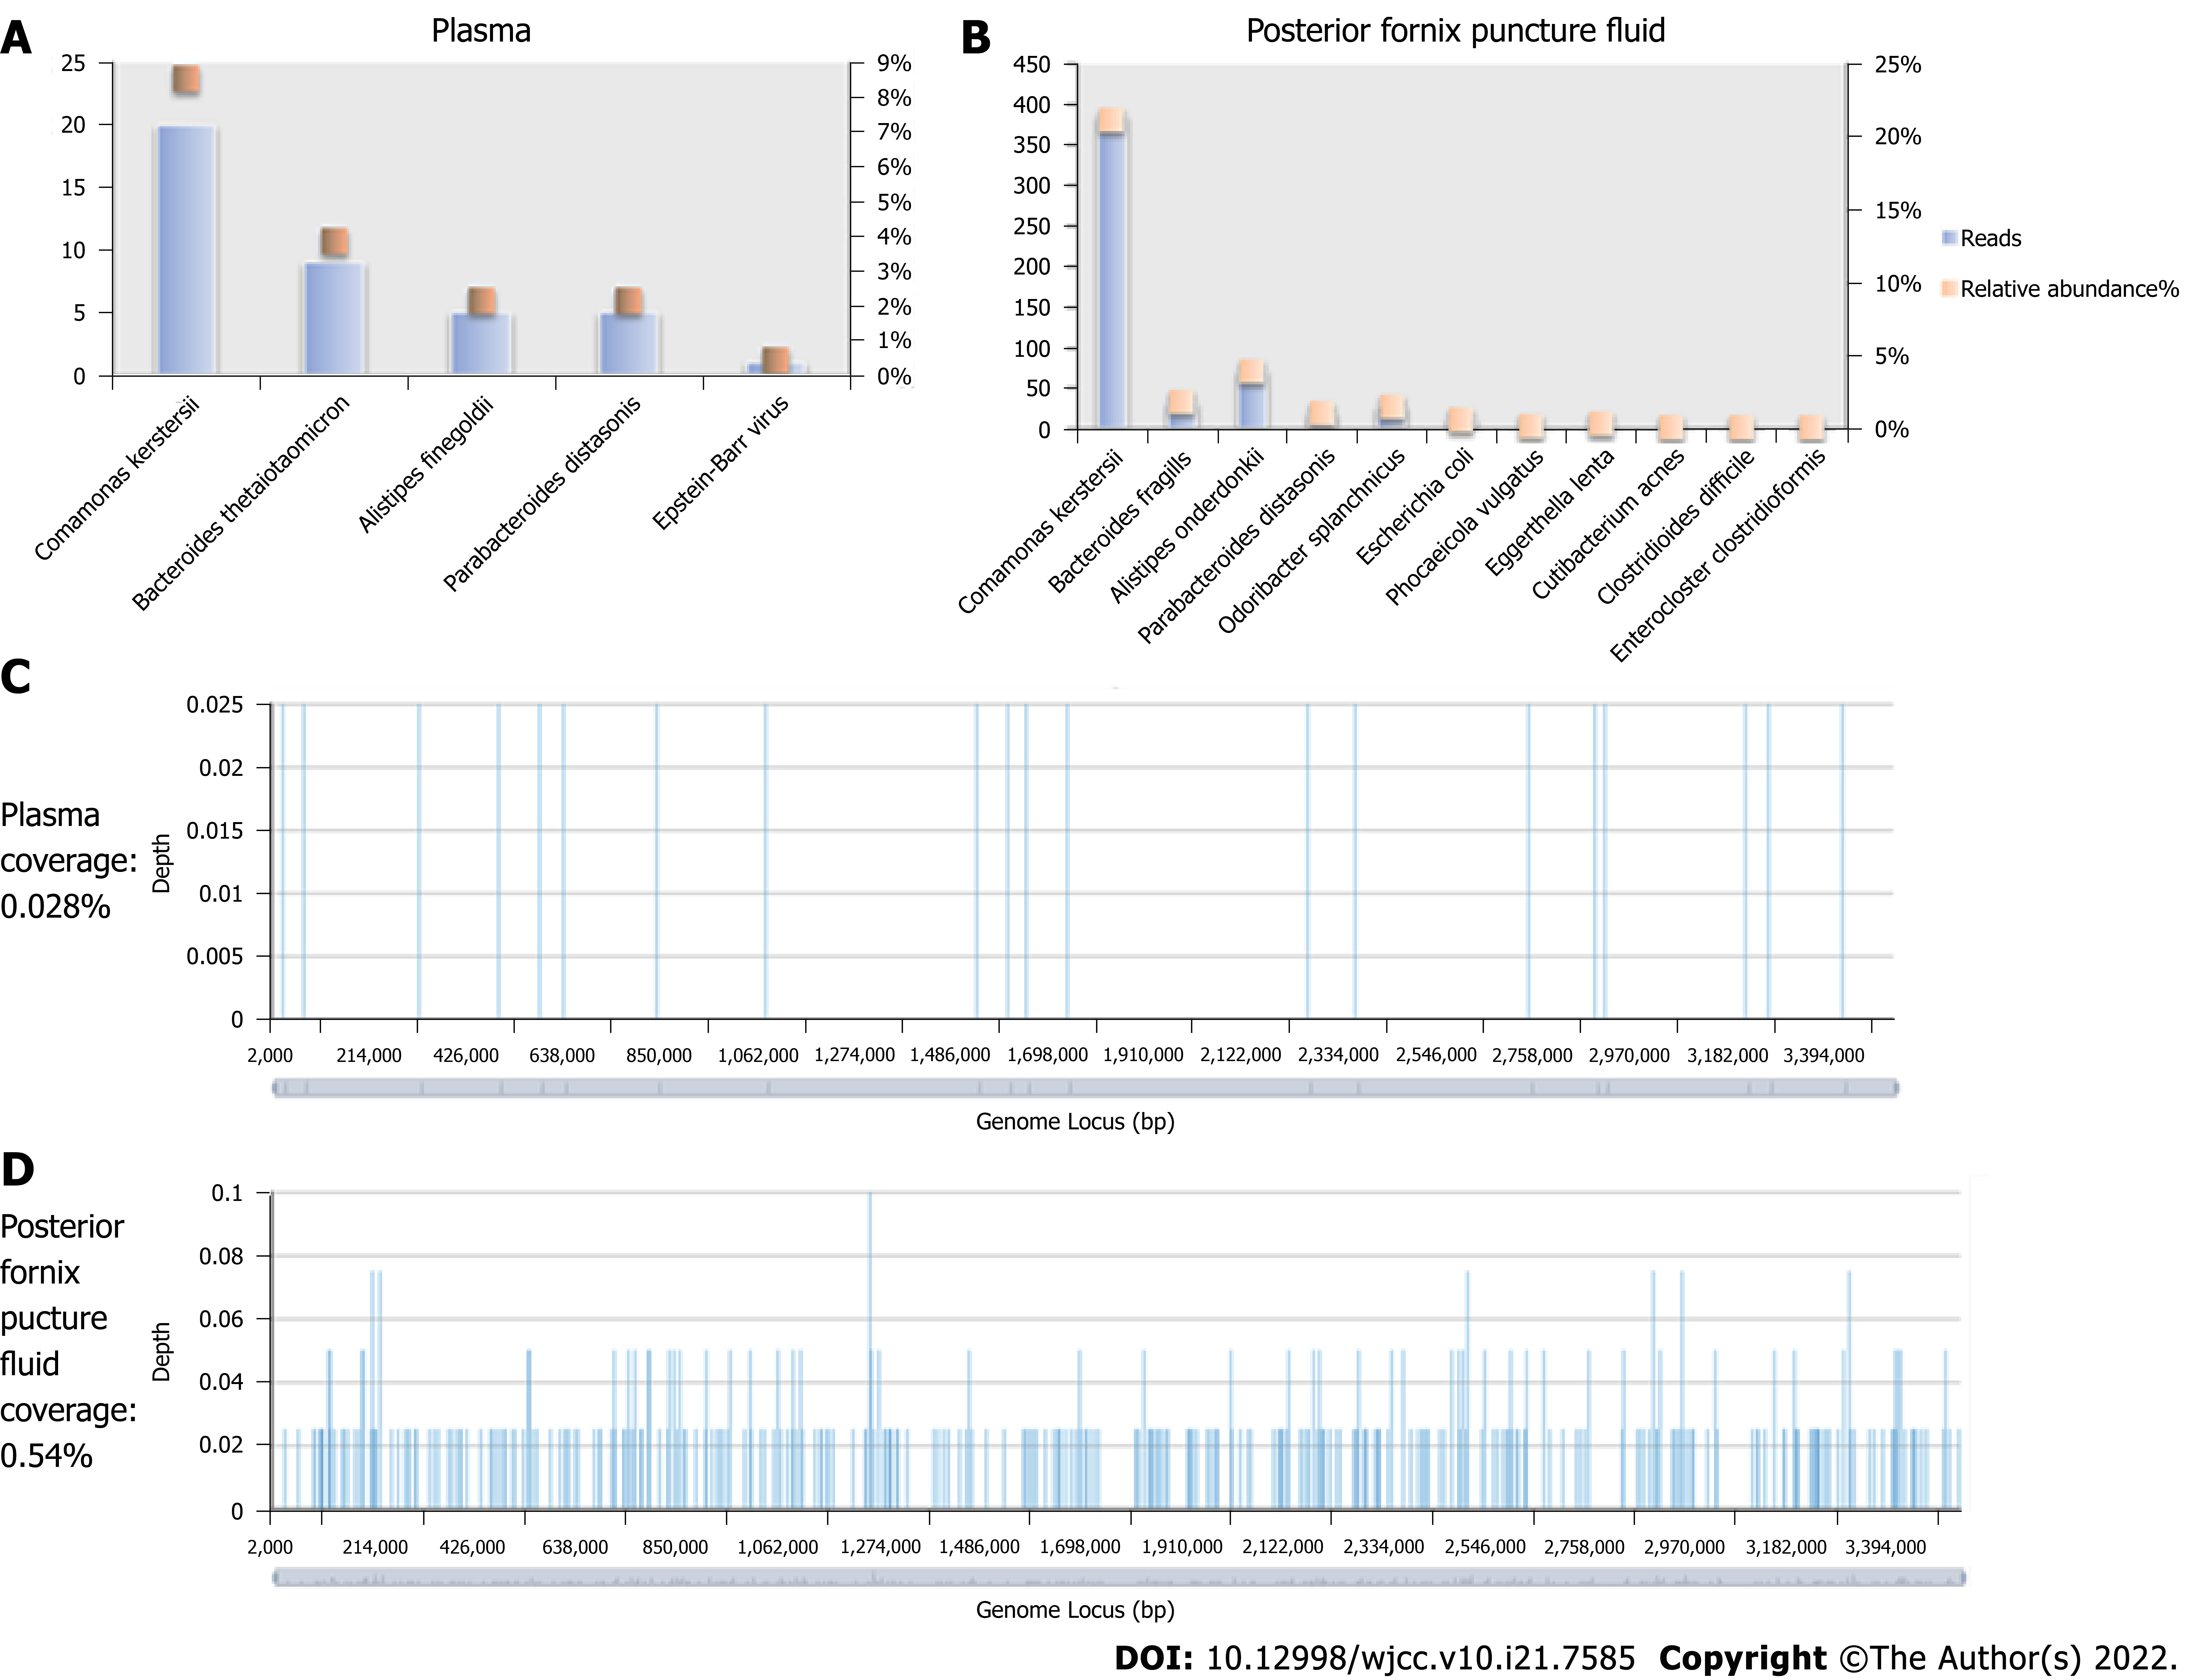
Figure 2 Detection of pathogens by metagenomic next-generation sequencing.
All the pathogens’ reads and relative abundance that were detected in blood (A) and in the posterior fornix puncture fluid (B). The coverage and proportion of Comamonas kerstersii detected by metagenomic next-generation sequencing in blood (C) and posterior fornix puncture fluid (D). Coverage is the percentage of all reads covering the reference genome, and the average depth is the reads’ read length multiplied by the number of reads divided by the size of the reference genome. The ordinate depth in the figure shows the number of times the detected pathogen sequences are compared with the reference template. The larger the depth and coverage values, the more likely the pathogen in the sample is real, and the higher the content.
- Citation: Qu H, Zhao YH, Zhu WM, Liu L, Zhu M. Maternal peripartum bacteremia caused by intrauterine infection with Comamonas kerstersii: A case report. World J Clin Cases 2022; 10(21): 7585-7591
- URL: https://www.wjgnet.com/2307-8960/full/v10/i21/7585.htm
- DOI: https://dx.doi.org/10.12998/wjcc.v10.i21.7585


