Copyright
©The Author(s) 2022.
World J Clin Cases. Jul 26, 2022; 10(21): 7577-7584
Published online Jul 26, 2022. doi: 10.12998/wjcc.v10.i21.7577
Published online Jul 26, 2022. doi: 10.12998/wjcc.v10.i21.7577
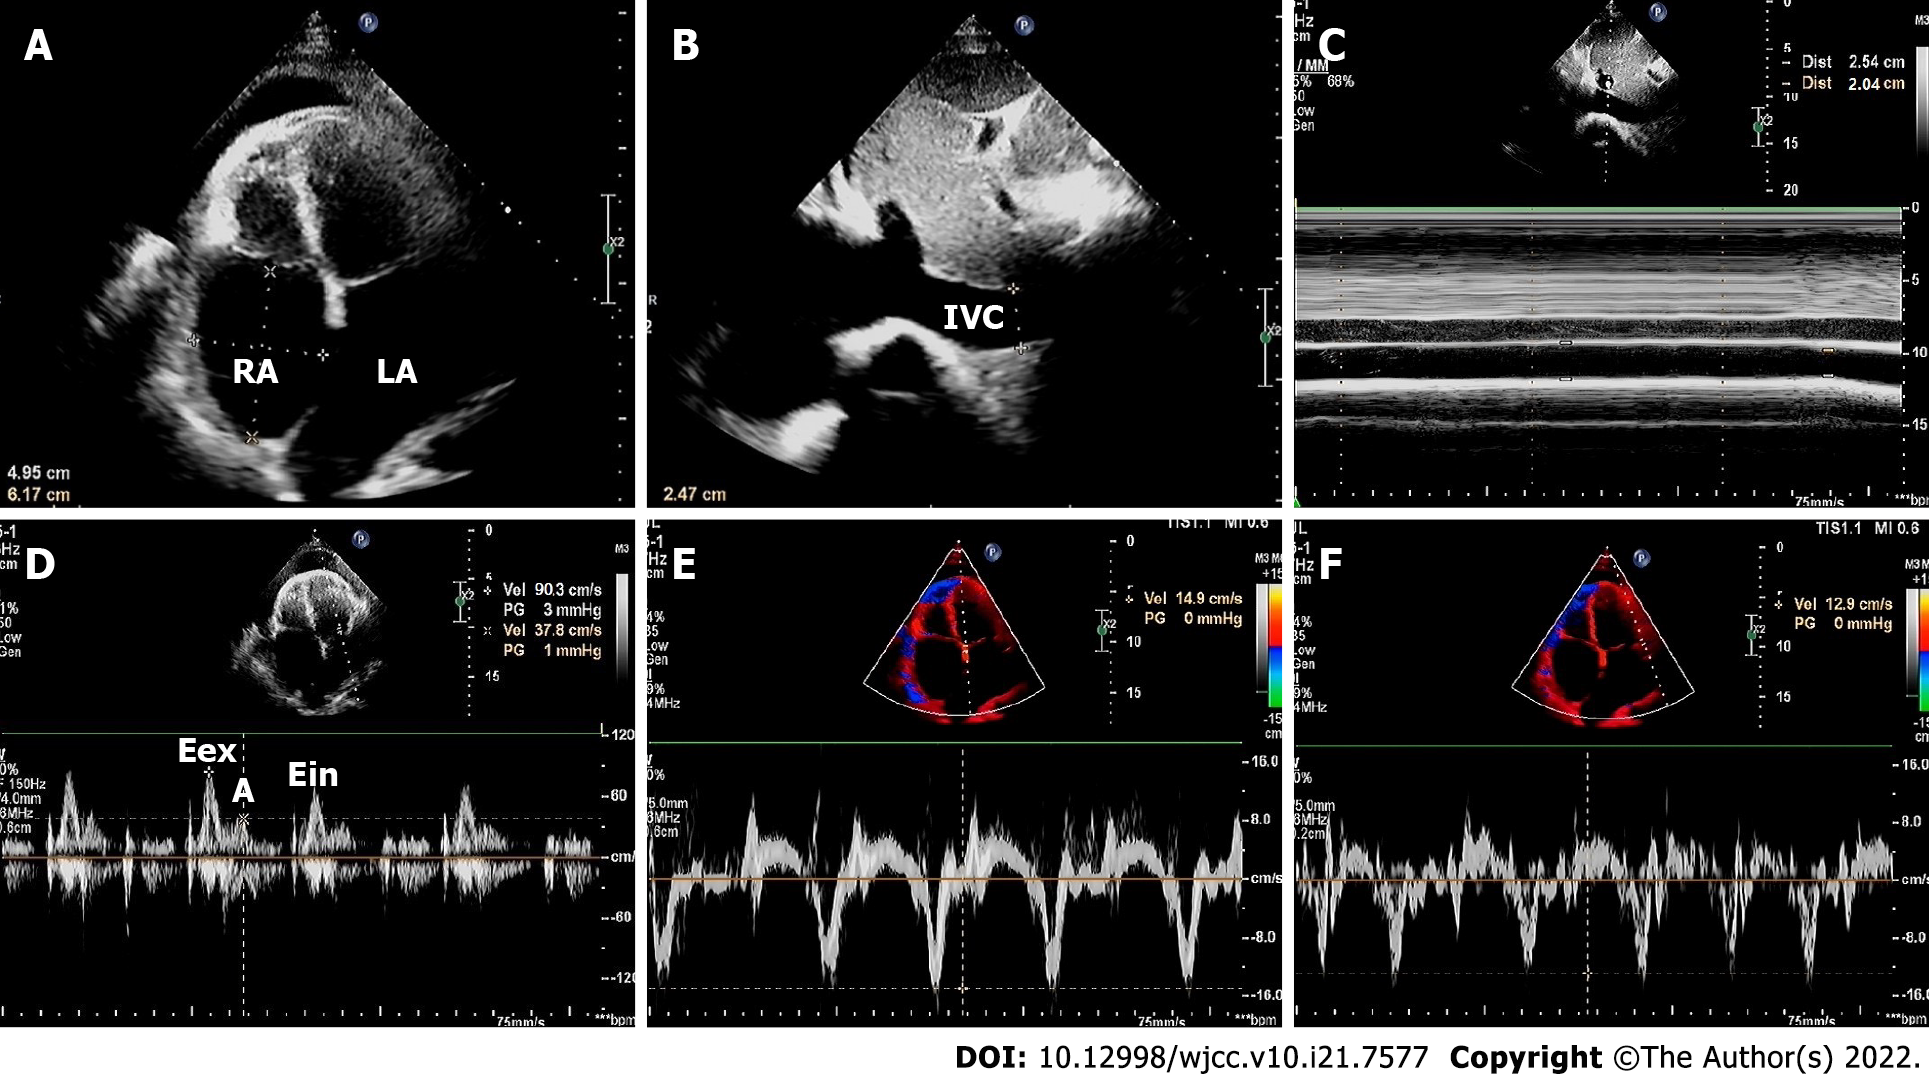
Figure 2 Echocardiographic examinations after pericardiocentesis.
A: Right atrial (50 mm × 62 mm) and left atrial (61 mm × 61 mm) enlargement, increased pericardial thickness, and pericardial effusion that was located predominantly along the apical wall (measuring up to 1.2 cm); B and C: Dilated inferior vena cava (up to 2.5 cm) almost without any aspiratory variation (20%), indicating an elevated right atrial pressure of approximately 20 mmHg; D: Pulsed wave doppler of the mitral valve showed that the peak mitral E and A inflow velocity were 90 cm/s and 38 cm/s, respectively. The E/A ratio was > 2, indicating restricted mitral inflow velocity. Respiratory variation in the peak mitral E inflow velocity was 28% (peak E velocity during expiration and inspiration were 90 cm/s and 65 cm/s, respectively); E and F: Tissue Doppler imaging showed “annulus reversus” with the lateral mitral e’ velocity (12.9 cm/s) abnormally lower than the medial mitral e’ velocity (14.9 cm/s). IVC: Inferior vena cava; LA: Left atrium; RA: Right atrium.
- Citation: Chen JL, Mei DE, Yu CG, Zhao ZY. Pseudomonas aeruginosa-related effusive-constrictive pericarditis diagnosed with echocardiography: A case report. World J Clin Cases 2022; 10(21): 7577-7584
- URL: https://www.wjgnet.com/2307-8960/full/v10/i21/7577.htm
- DOI: https://dx.doi.org/10.12998/wjcc.v10.i21.7577


