Copyright
©The Author(s) 2022.
World J Clin Cases. Jul 16, 2022; 10(20): 7097-7104
Published online Jul 16, 2022. doi: 10.12998/wjcc.v10.i20.7097
Published online Jul 16, 2022. doi: 10.12998/wjcc.v10.i20.7097
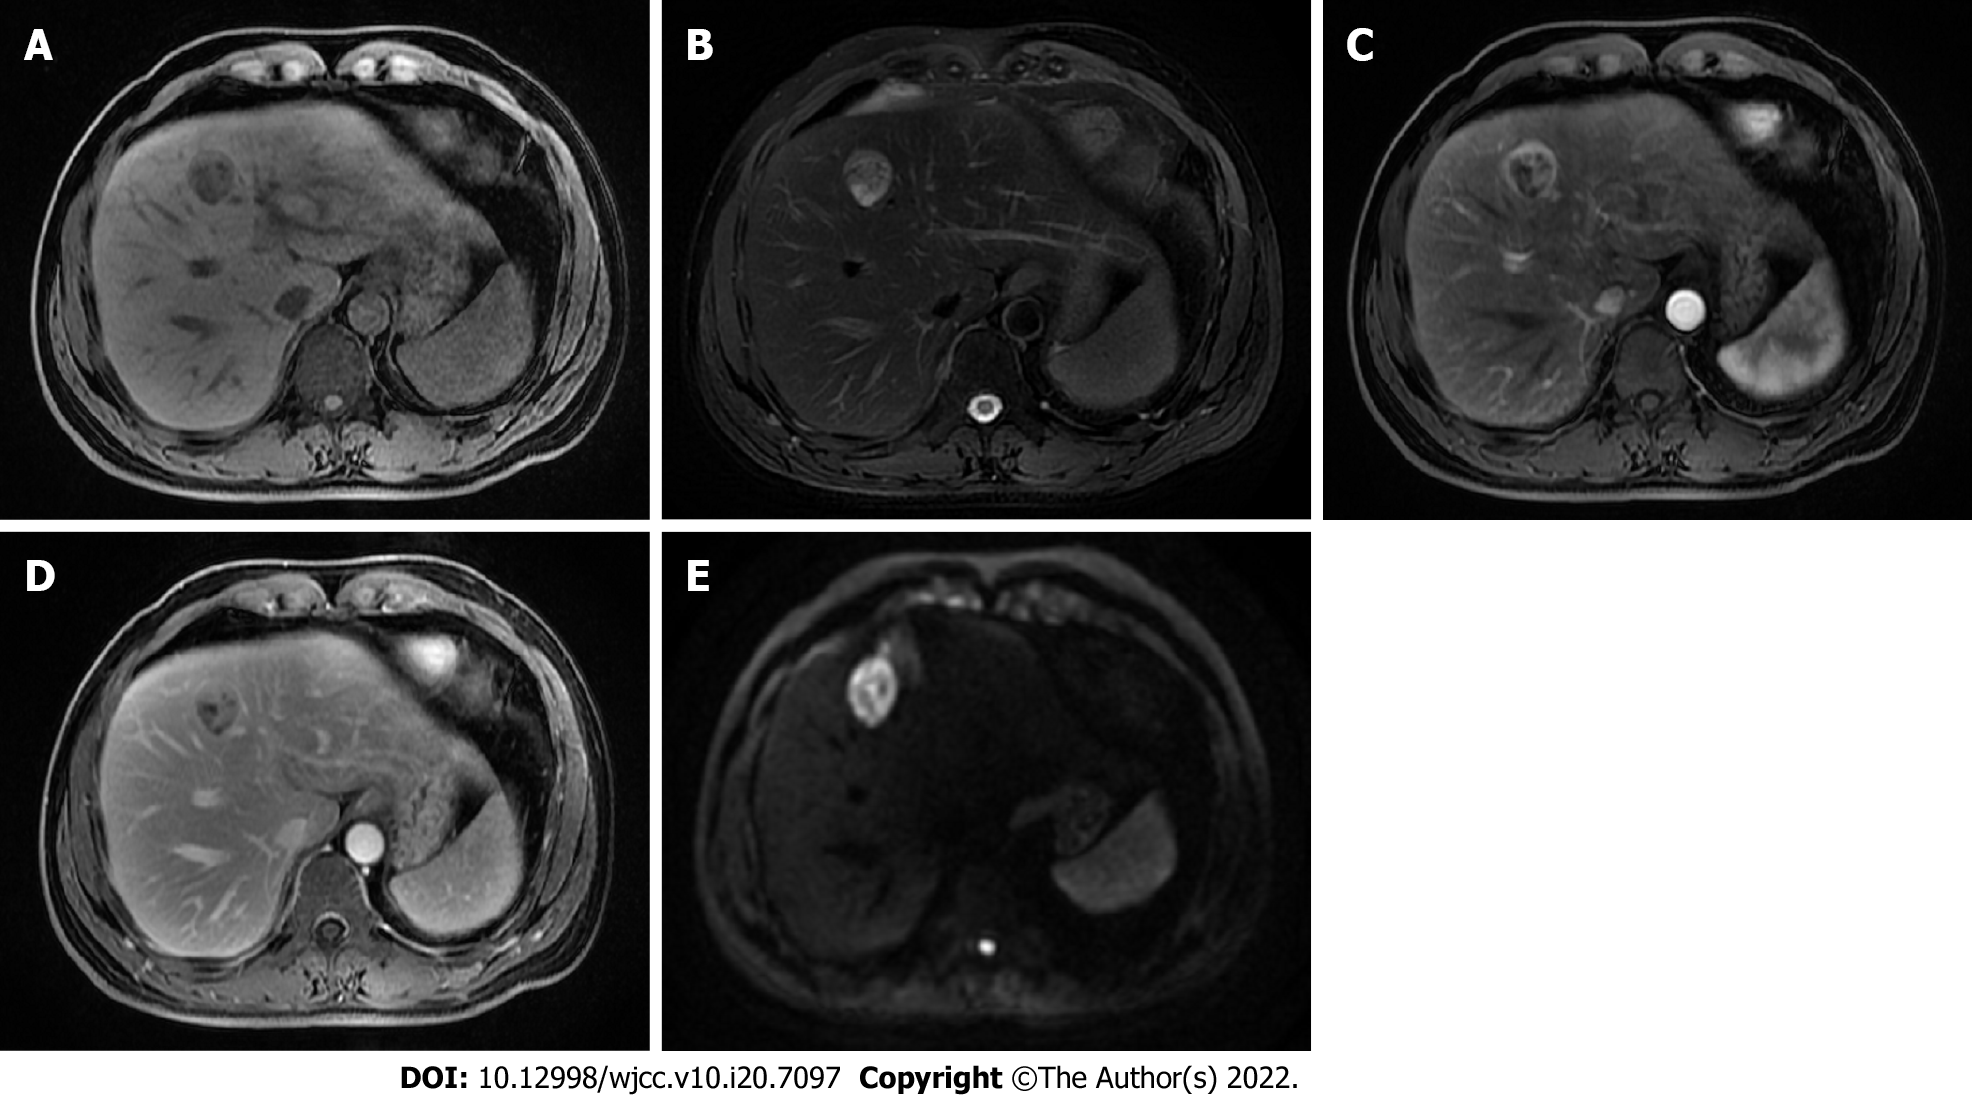
Figure 1 Contrast-enhanced liver magnetic resonance.
A: T1-weighted image showing a slight hypointense mass; B: Mass showing iso- to hyperintensity on T2-weighted image, and the size was 2.7 cm × 2.3 cm; C: Well enhanced mass in the arterial phase; D: lower intensity of the mass compared with the surrounding parenchyma during the portal venous phase; E: Diffusion-weighted imaging showing higher intensity of the mass compared to the normal liver tissue.
- Citation: Xie GY, Zhu HB, Jin Y, Li BZ, Yu YQ, Li JT. Solitary fibrous tumor of the liver: A case report and review of the literature. World J Clin Cases 2022; 10(20): 7097-7104
- URL: https://www.wjgnet.com/2307-8960/full/v10/i20/7097.htm
- DOI: https://dx.doi.org/10.12998/wjcc.v10.i20.7097


