Copyright
©The Author(s) 2022.
World J Clin Cases. Jul 16, 2022; 10(20): 6825-6844
Published online Jul 16, 2022. doi: 10.12998/wjcc.v10.i20.6825
Published online Jul 16, 2022. doi: 10.12998/wjcc.v10.i20.6825
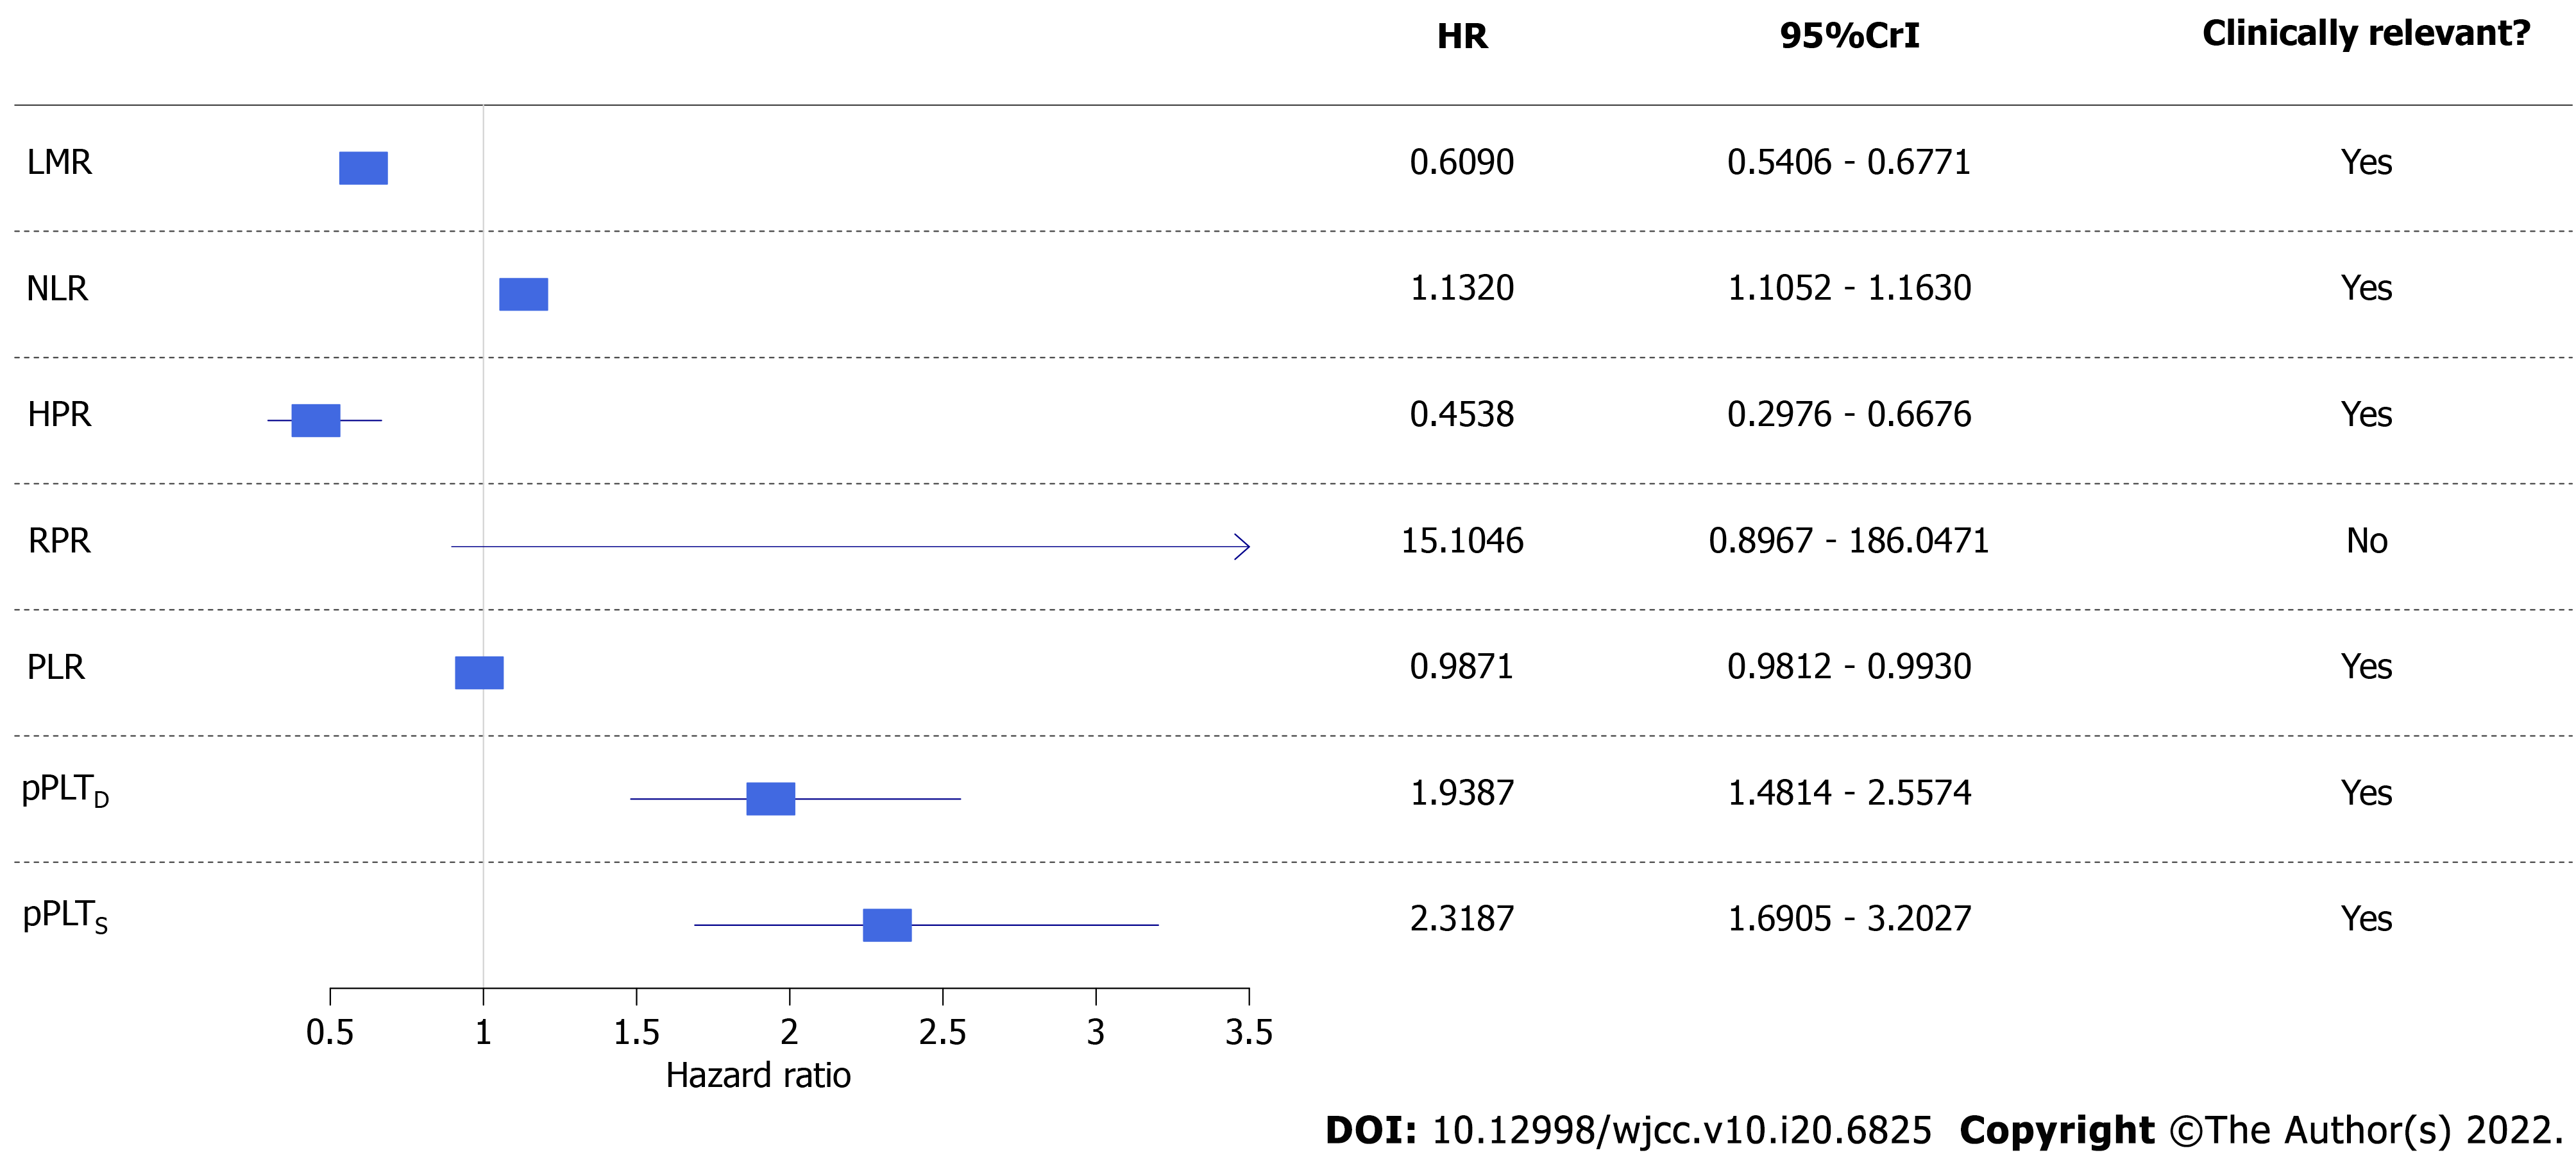
Figure 6 Forest plot of univariate Bayesian joint-models.
Higher risk of all-cause mortality was associated with a lower lymphocyte-to-monocyte ratio, hemoglobin-to-platelet ratio, and platelet-to-lymphocyte ratio and higher neutrophil-to-lymphocyte ratio, personalized platelet count relative to “at-diagnosis”, and personalized platelet count relative to “after-surgery”. Red blood cell distribution width-to-platelet ratio did not affect all-cause mortality of study participants. CrI: Credible interval; HR: Hazard ratio; LMR: Lymphocyte-to-monocyte ratio; PLR: Platelet-to-lymphocyte ratio; NLR: Neutrophil-to-lymphocyte ratio; HPR: hemoglobin-to-platelet ratio; RPR: red blood cell distribution width-to-platelet ratio; pPLTD: Personalized platelet count relative to “at-diagnosis”; pPLTS: Personalized platelet count relative to “after-surgery”. Bayesian statistical methods do not give P values, and evaluation of results was detailed in methods.
- Citation: Herold Z, Herold M, Lohinszky J, Szasz AM, Dank M, Somogyi A. Longitudinal changes in personalized platelet count metrics are good indicators of initial 3-year outcome in colorectal cancer. World J Clin Cases 2022; 10(20): 6825-6844
- URL: https://www.wjgnet.com/2307-8960/full/v10/i20/6825.htm
- DOI: https://dx.doi.org/10.12998/wjcc.v10.i20.6825


