Copyright
©The Author(s) 2022.
World J Clin Cases. Jul 16, 2022; 10(20): 6825-6844
Published online Jul 16, 2022. doi: 10.12998/wjcc.v10.i20.6825
Published online Jul 16, 2022. doi: 10.12998/wjcc.v10.i20.6825
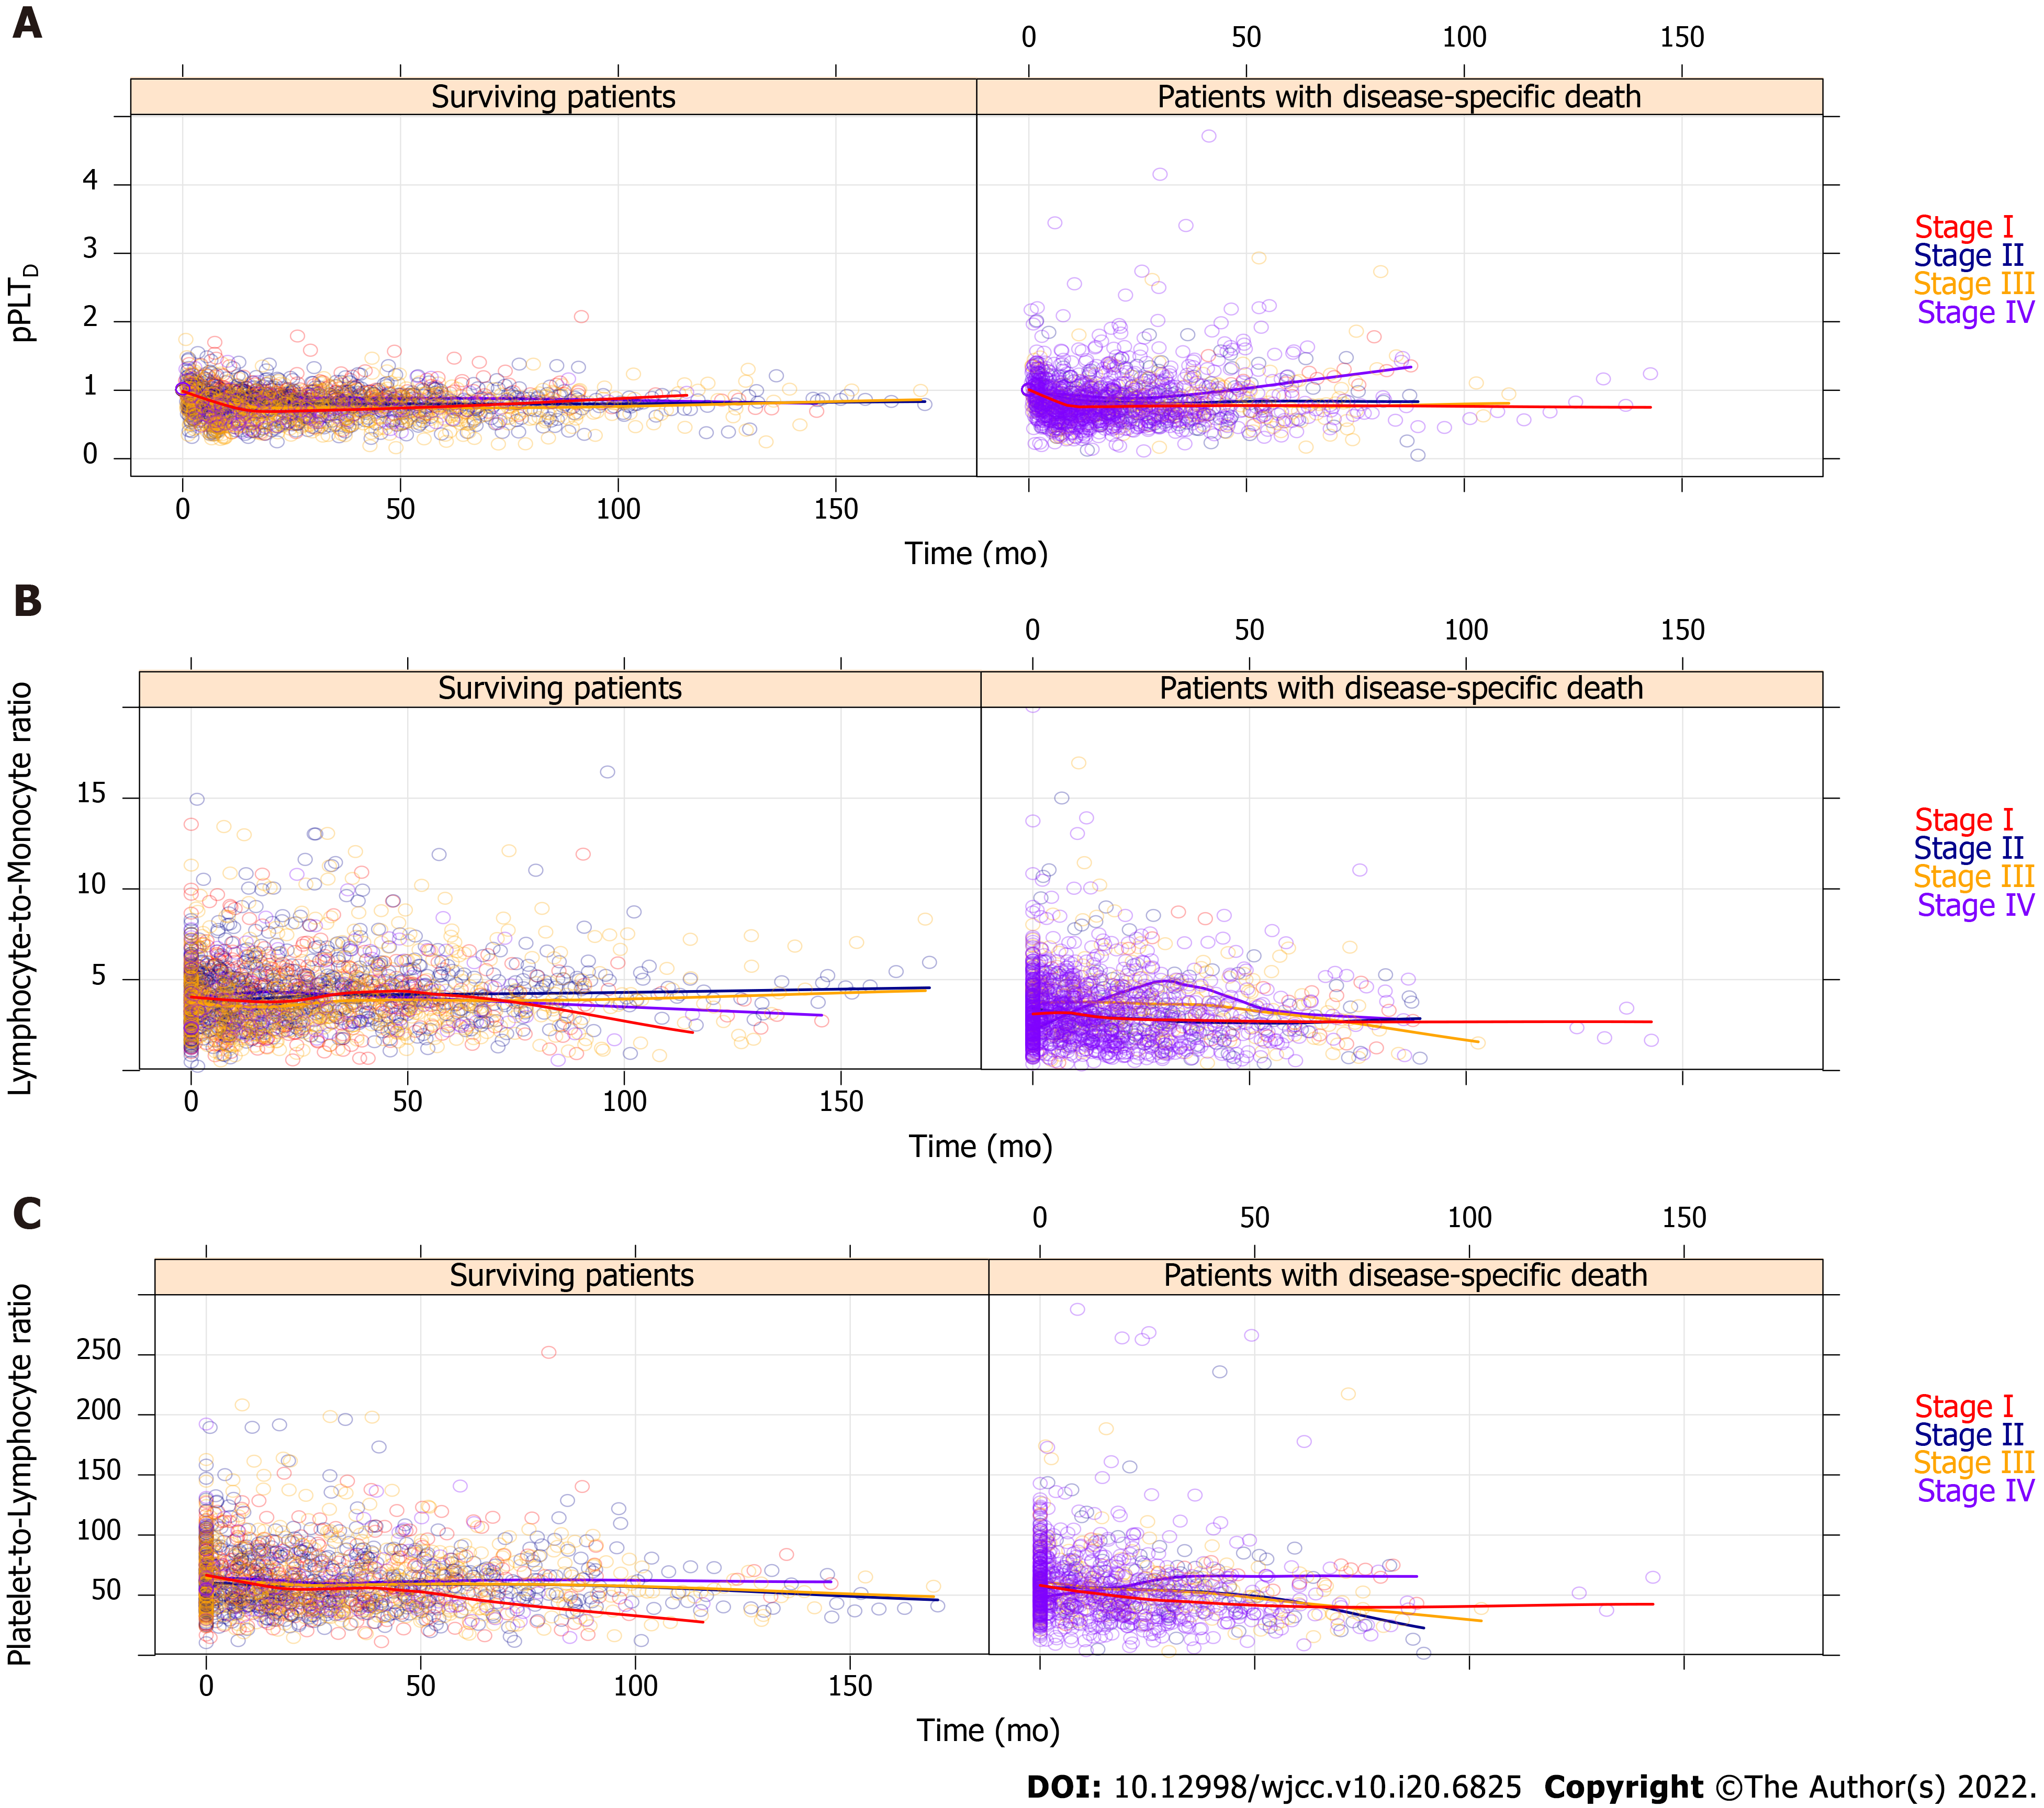
Figure 5 All recorded personalized platelet count relative to “at-diagnosis” (pPLTD), lymphocyte-to-monocyte ratio, and platelet-to-lymphocyte ratio values of the 835 study participants, which have been stratified by American Joint Committee on Cancer staging[21].
For better view, the remaining complete blood count ratios are drawn on Supplementary Figure 1. Regression curves are not drawn from the actual spline adjusted mixed effect model, but the automatic smoothing curve of the plotting process.
- Citation: Herold Z, Herold M, Lohinszky J, Szasz AM, Dank M, Somogyi A. Longitudinal changes in personalized platelet count metrics are good indicators of initial 3-year outcome in colorectal cancer. World J Clin Cases 2022; 10(20): 6825-6844
- URL: https://www.wjgnet.com/2307-8960/full/v10/i20/6825.htm
- DOI: https://dx.doi.org/10.12998/wjcc.v10.i20.6825


