Copyright
©The Author(s) 2022.
World J Clin Cases. Jul 16, 2022; 10(20): 6811-6824
Published online Jul 16, 2022. doi: 10.12998/wjcc.v10.i20.6811
Published online Jul 16, 2022. doi: 10.12998/wjcc.v10.i20.6811
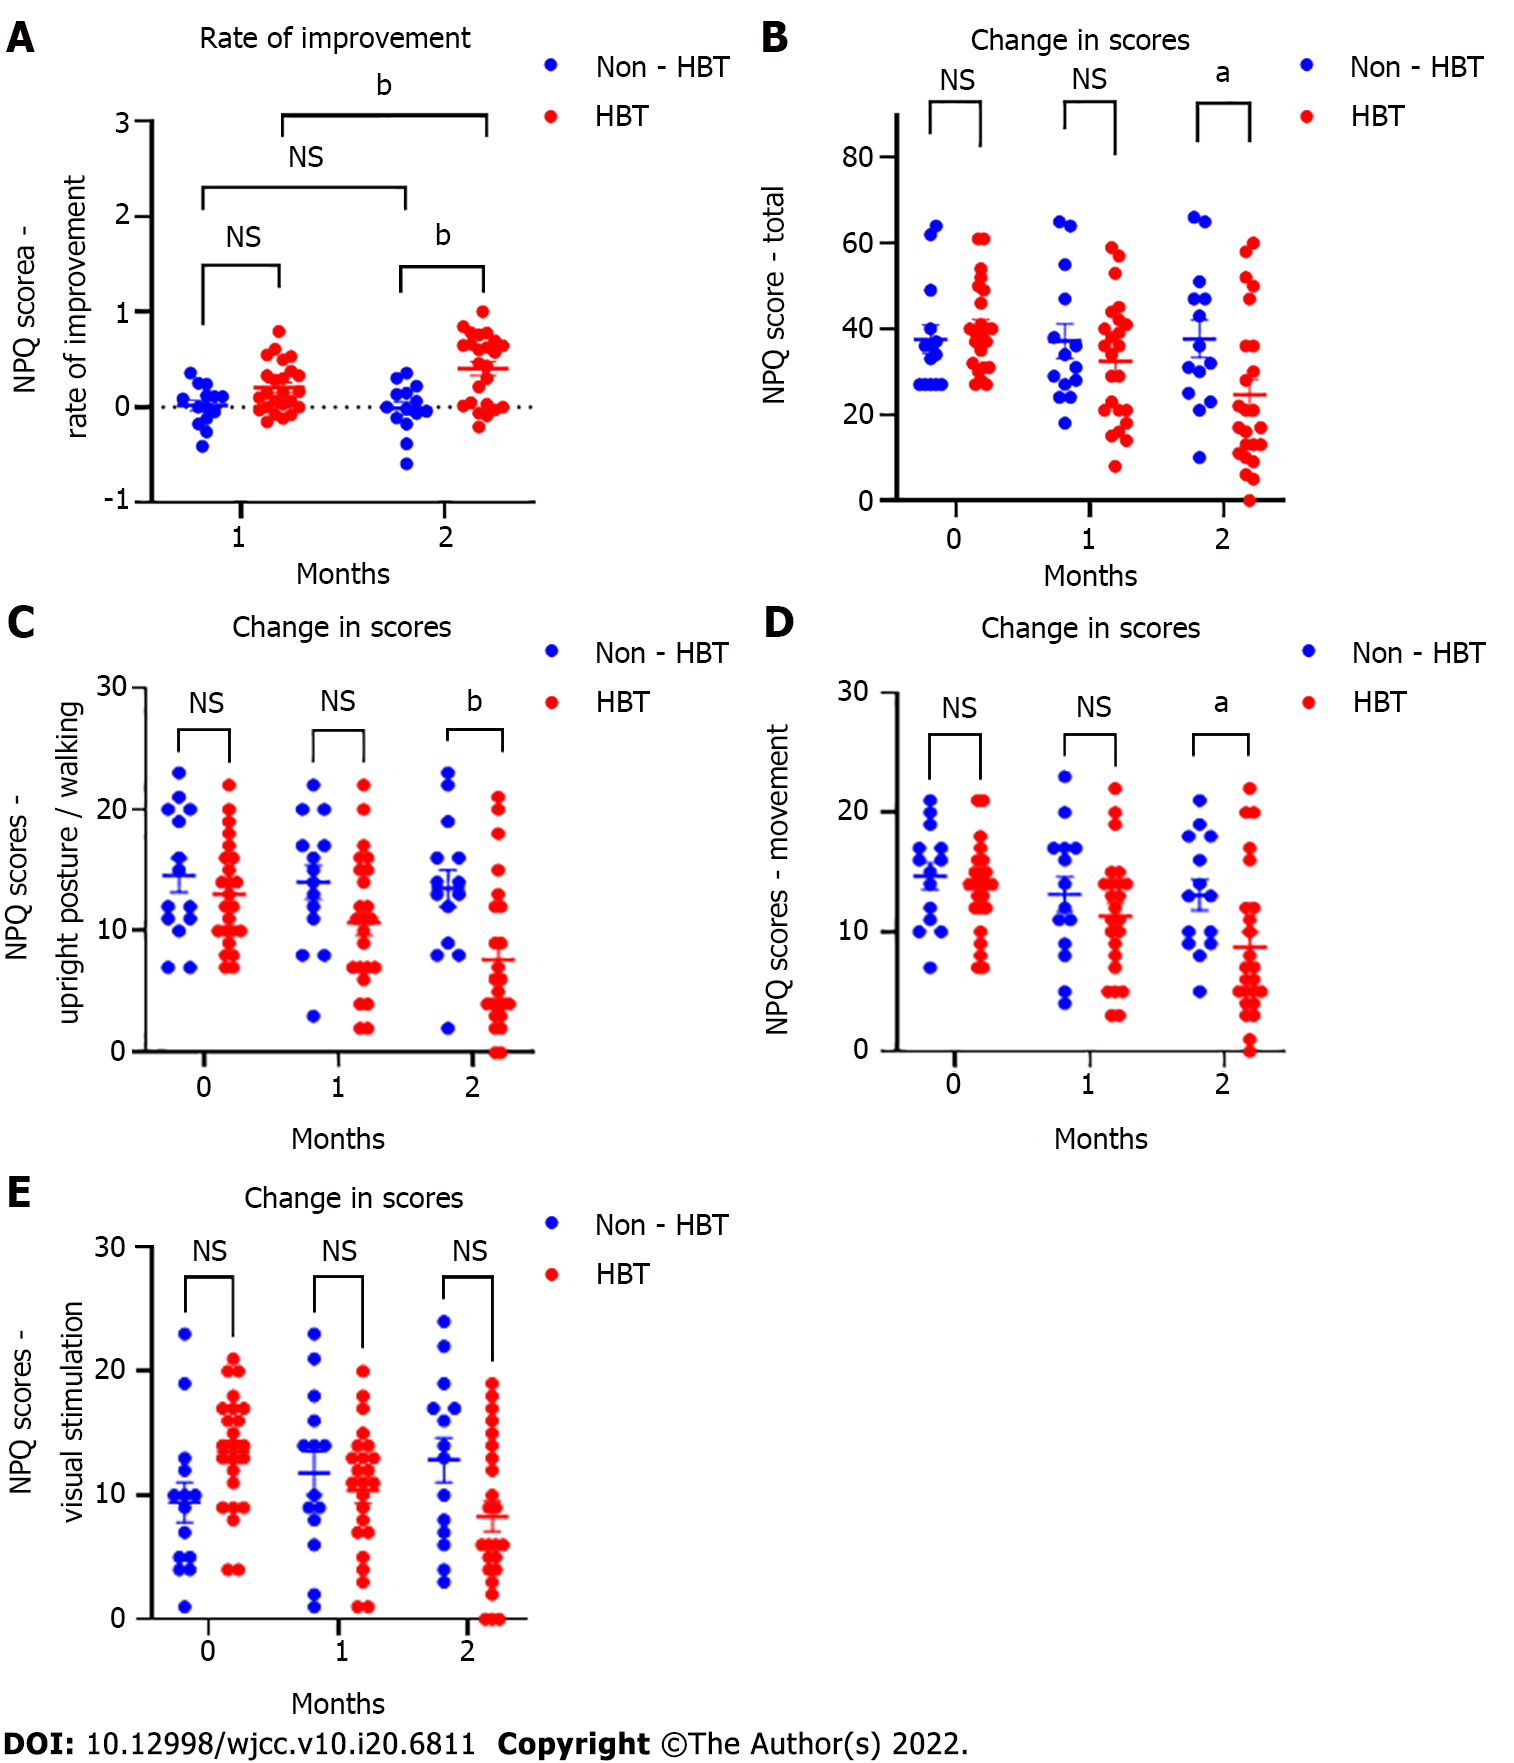
Figure 3 Comparison of rate of improvement and Niigata persistent postural-perceptual dizziness questionnaire scores between groups.
A: Comparisons between groups revealed significant differences in the rate of Niigata persistent postural-perceptual dizziness questionnaire (NPQ) improvement (1 mo, P = 0.16; 2 mo, P = 0.009); B-E: There were significant differences in NPQ total scores, upright posture/walking scores, and movement scores at 2 mo between groups; B: Total score: Baseline, P > 0.99; 1 mo, P = 0.89; 2 mo, P = 0.02; C: Upright posture/walking: Baseline, P > 0.99; 1 mo, P = 0.21; 2 mo, P = 0.005; D: Movement: Baseline, P > 0.99; 1 mo, P = 0.87; 2 mo, P = 0.03; E: Visual stimulation: Baseline, P = 0.11; 1 mo, P > 0.99; 2 mo, P = 0.06. aP < 0.05; bP < 0.01; cP < 0.001. Data represent mean and standard error (vertical bars). NPQ: Niigata PPPD questionnaire; HBT: Hangebyakujutsutemmato; PPPD: Persistent postural-perceptual dizziness; NS: Not significant.
- Citation: Miwa T, Kanemaru SI. Effects of Kampo medicine hangebyakujutsutemmato on persistent postural-perceptual dizziness: A retrospective pilot study. World J Clin Cases 2022; 10(20): 6811-6824
- URL: https://www.wjgnet.com/2307-8960/full/v10/i20/6811.htm
- DOI: https://dx.doi.org/10.12998/wjcc.v10.i20.6811


