Copyright
©The Author(s) 2022.
World J Clin Cases. Jun 16, 2022; 10(17): 5566-5576
Published online Jun 16, 2022. doi: 10.12998/wjcc.v10.i17.5566
Published online Jun 16, 2022. doi: 10.12998/wjcc.v10.i17.5566
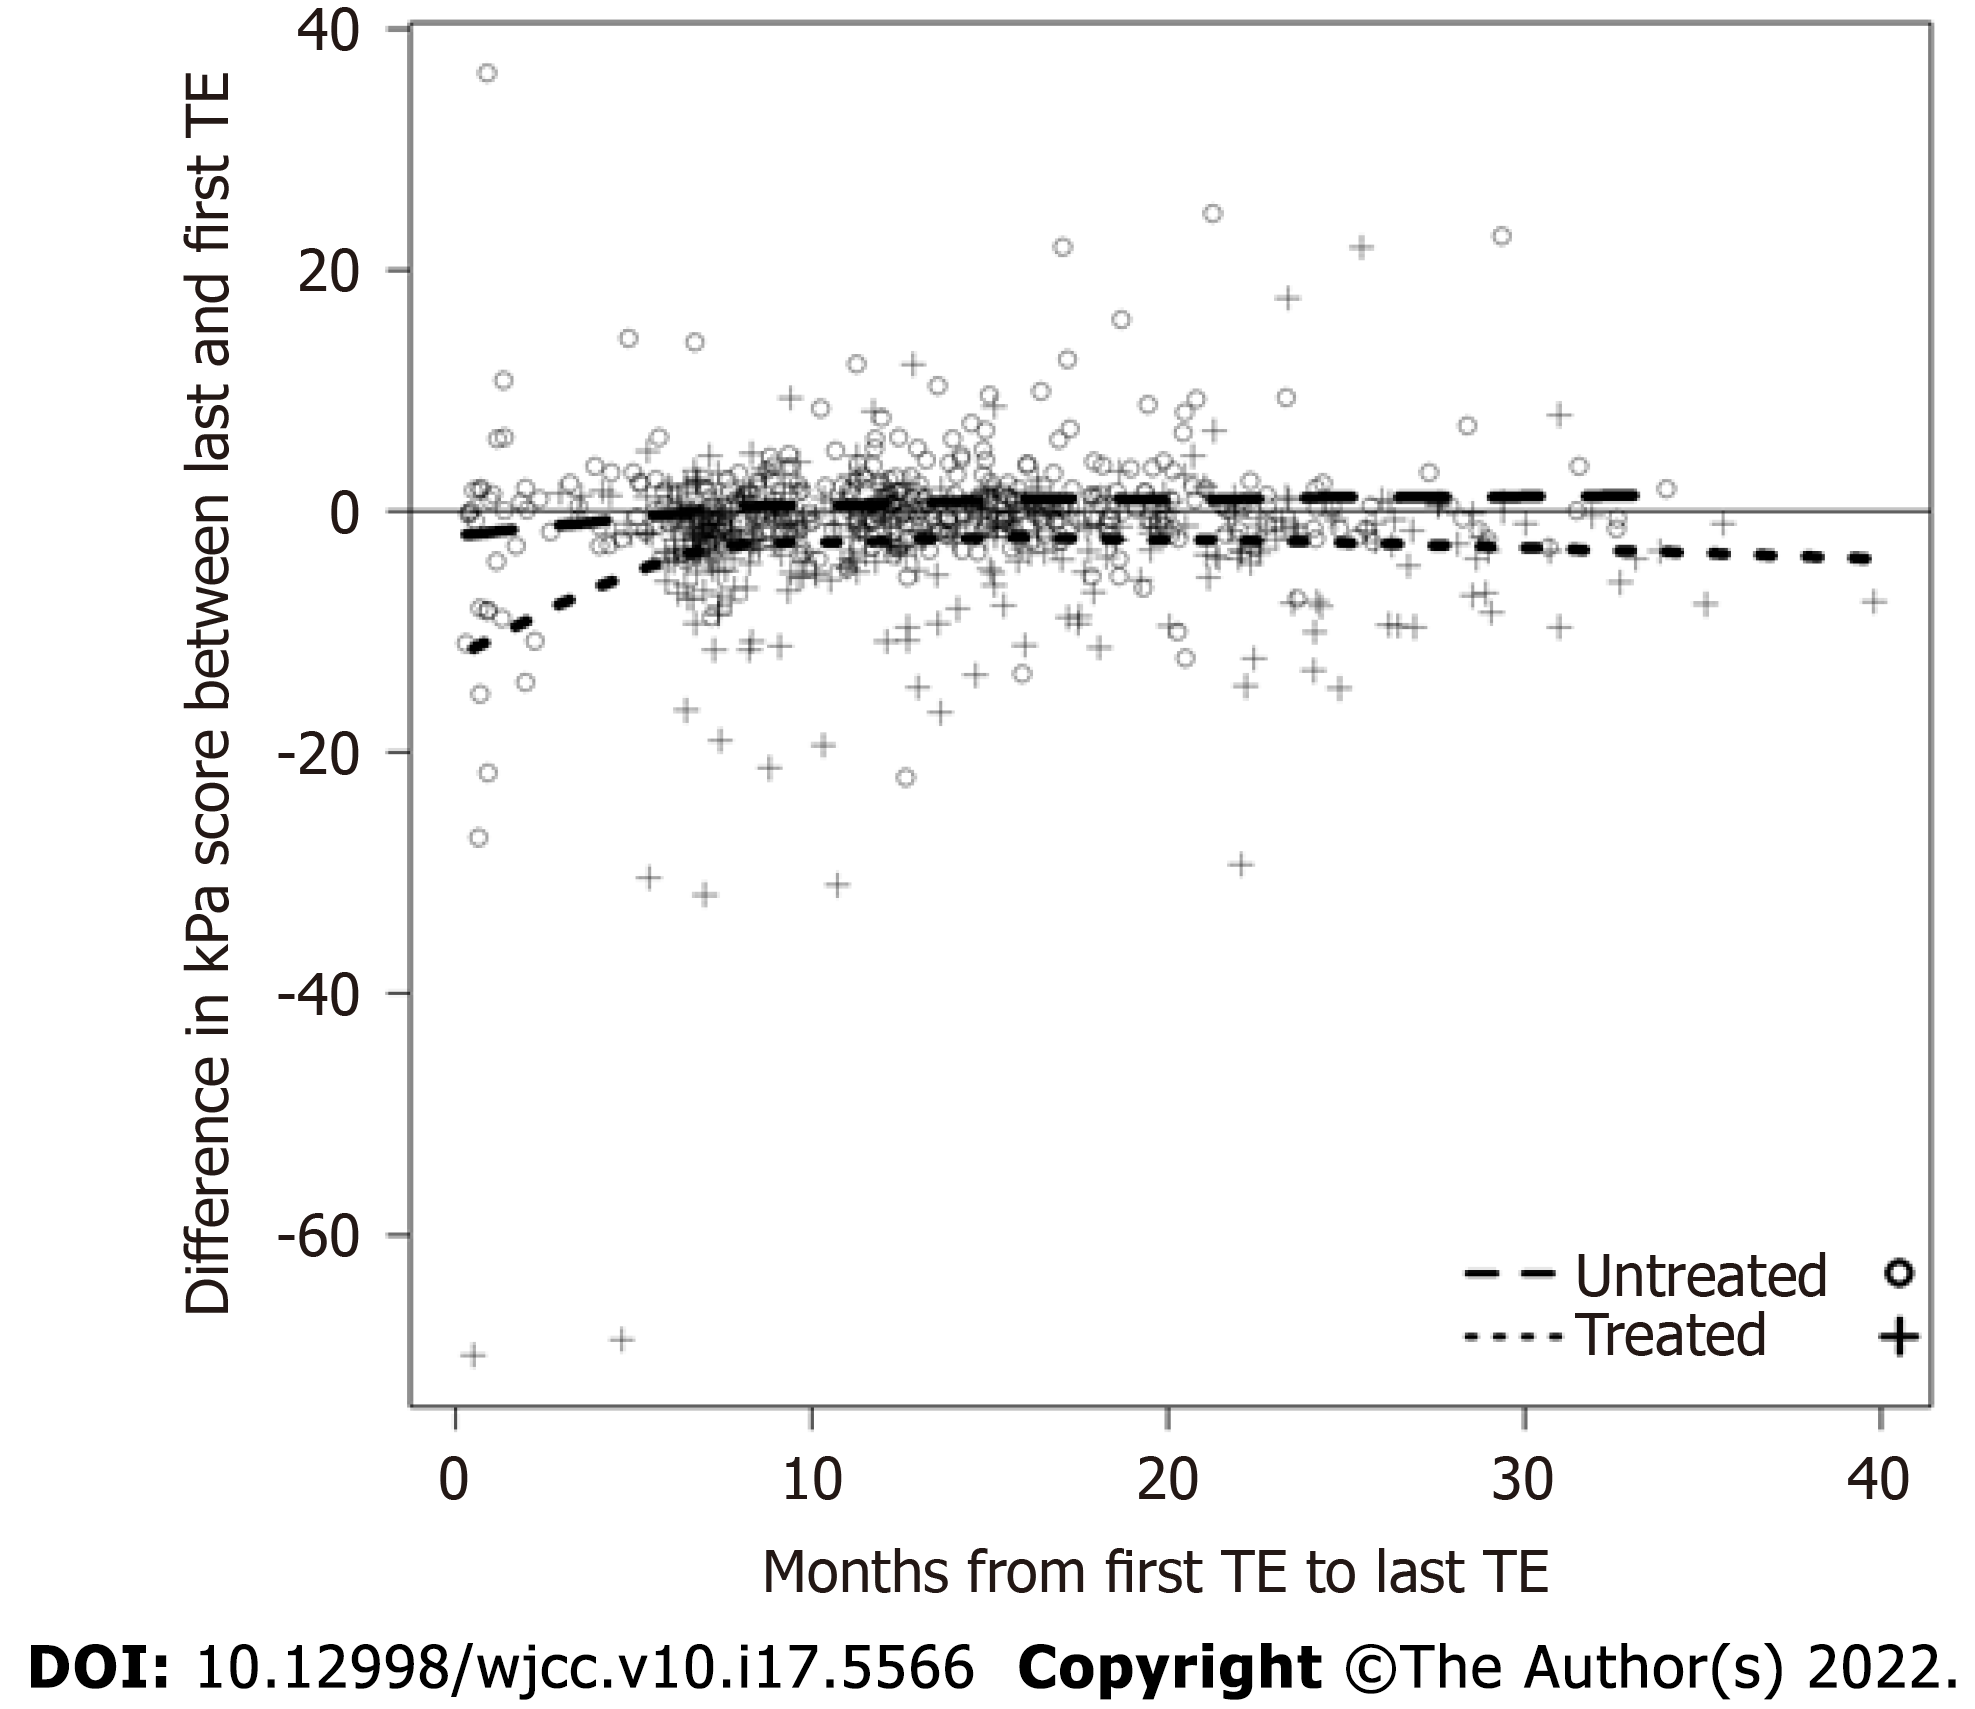
Figure 1 Change in liver stiffness between first and last transient elastography measurement in patients with chronic hepatitis C infection.
Scatter plot illustrating the difference in liver stiffness (kPa) between the first and last transient elastography measurement for patients who were treated (n = 405) and not treated (n = 365) with direct-acting antiviral therapy for chronic hepatitis C infection during the study period. Circles correspond to values for individual patients. kPa: Kilopascals; TE: Transient elastography.
- Citation: Mezina A, Krishnan A, Woreta TA, Rubenstein KB, Watson E, Chen PH, Rodriguez-Watson C. Longitudinal assessment of liver stiffness by transient elastography for chronic hepatitis C patients. World J Clin Cases 2022; 10(17): 5566-5576
- URL: https://www.wjgnet.com/2307-8960/full/v10/i17/5566.htm
- DOI: https://dx.doi.org/10.12998/wjcc.v10.i17.5566


