Copyright
©The Author(s) 2022.
World J Clin Cases. May 26, 2022; 10(15): 4737-4760
Published online May 26, 2022. doi: 10.12998/wjcc.v10.i15.4737
Published online May 26, 2022. doi: 10.12998/wjcc.v10.i15.4737
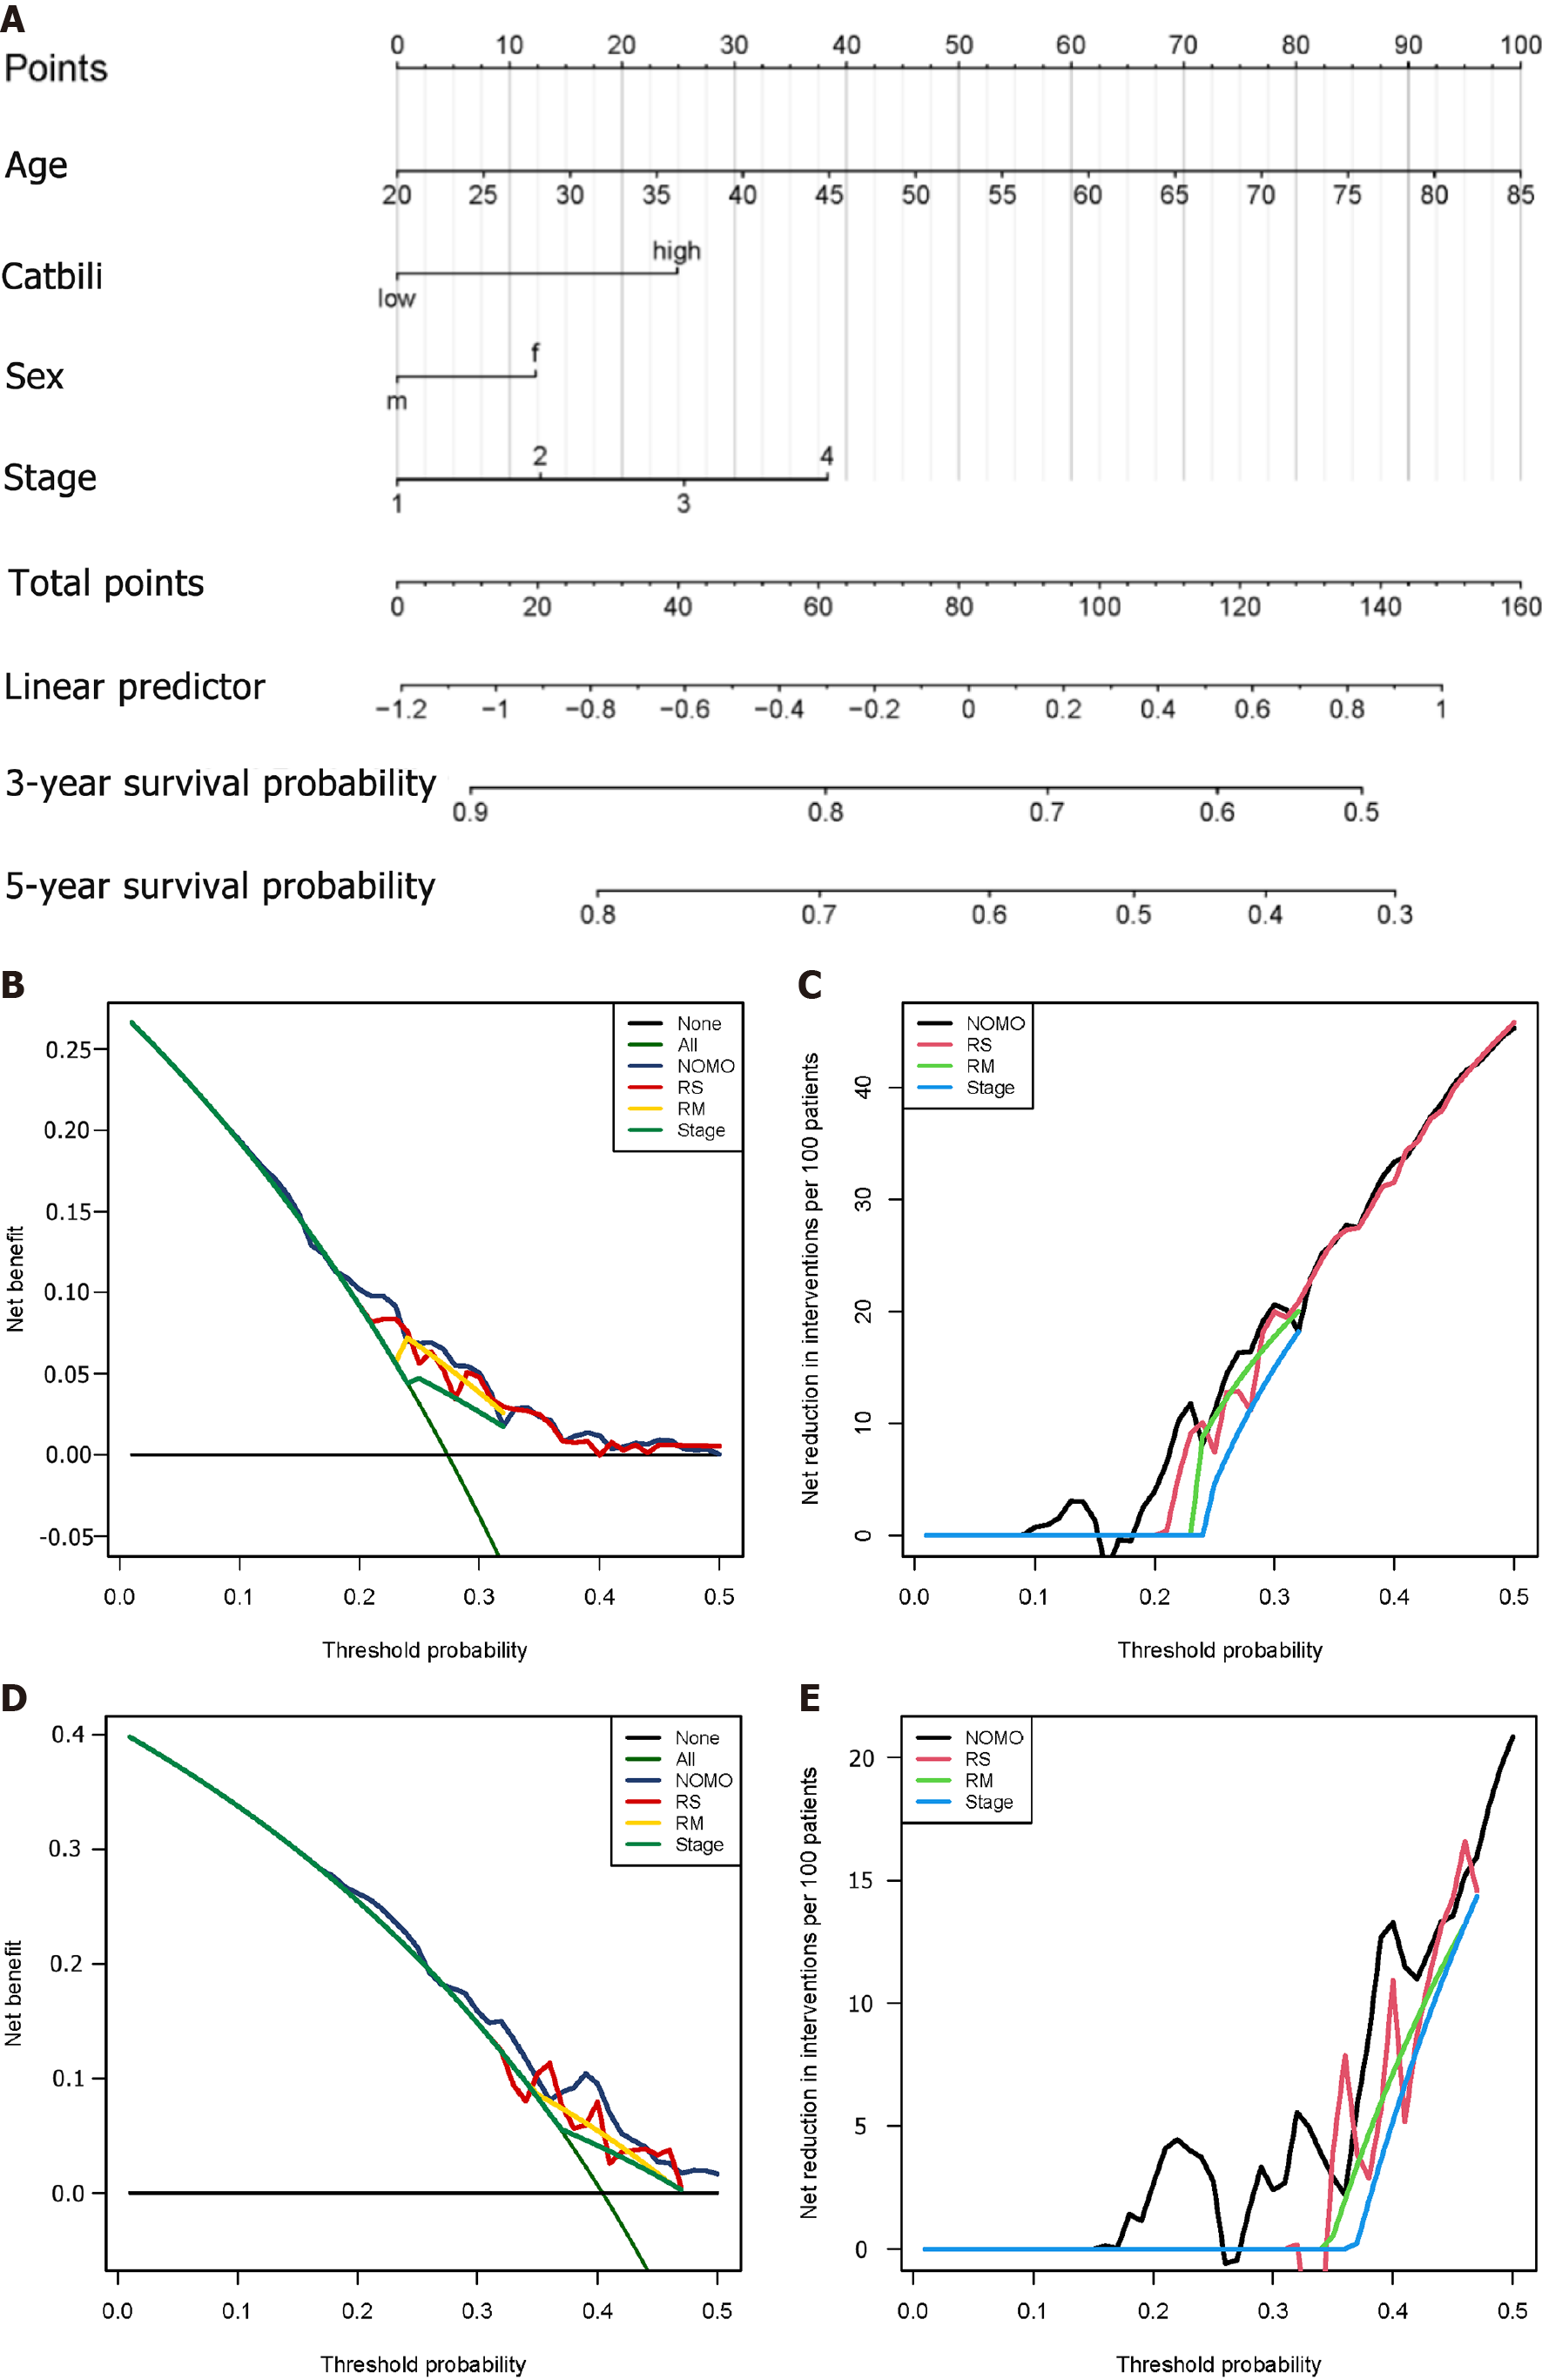
Figure 12 Construction of nomogram and efficiency evaluation.
A: Nomogram shows weighted point of each factor, including staging, gender, age, and risk score; B and C: The decision curve analysis of nomogram in training set for overall survival; D and E: The net reduction interventions per 100 patients could benefit based on the decision derived from different modules: Risk score (risk group classified by risk module, stage module) and NOMO (module combined by risk score, age, sex and stage).
- Citation: Zou JY, Huang YJ, He J, Tang ZX, Qin L. Glycolytic and fatty acid oxidation genes affect the treatment and prognosis of liver cancer. World J Clin Cases 2022; 10(15): 4737-4760
- URL: https://www.wjgnet.com/2307-8960/full/v10/i15/4737.htm
- DOI: https://dx.doi.org/10.12998/wjcc.v10.i15.4737


