Copyright
©The Author(s) 2022.
World J Clin Cases. May 26, 2022; 10(15): 4737-4760
Published online May 26, 2022. doi: 10.12998/wjcc.v10.i15.4737
Published online May 26, 2022. doi: 10.12998/wjcc.v10.i15.4737
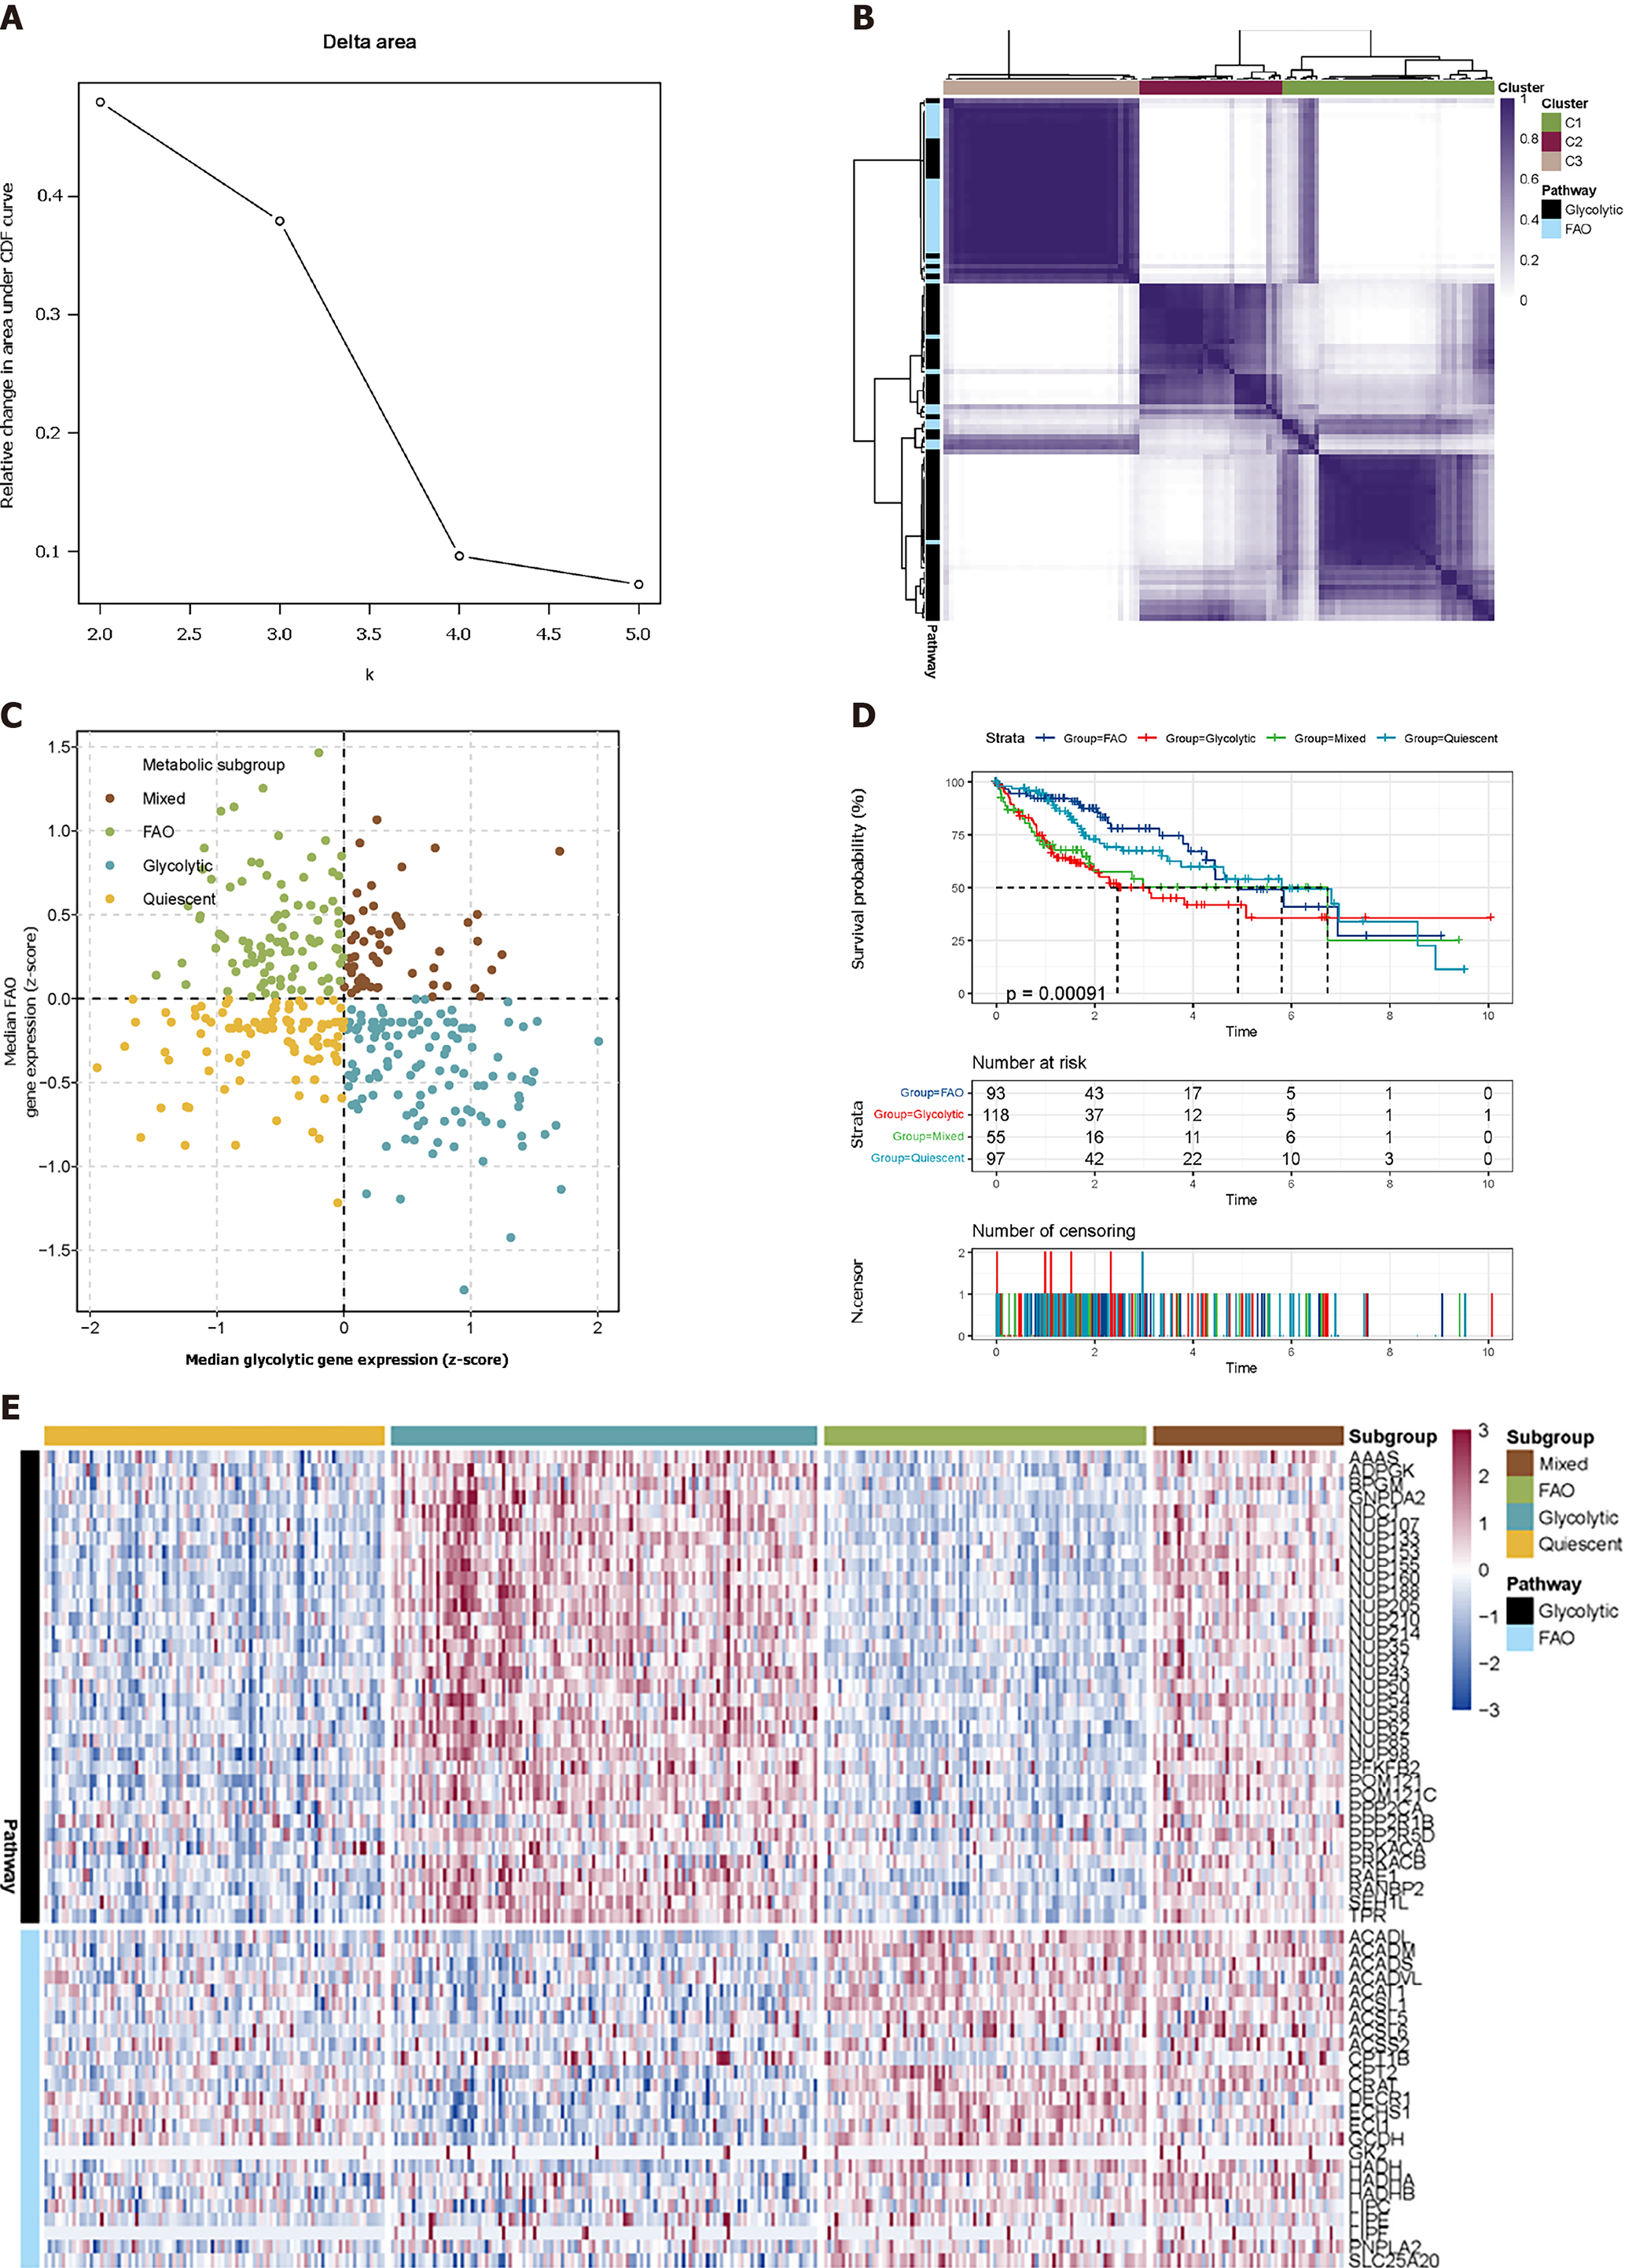
Figure 1 Classification of liver hepatocellular carcinoma tumours depending on the median expression of fatty acid oxidation and glycolytic genes.
A: Delta area shows that the cluster works best when K = 3; B: Heatmap shows three consensus clustering results. Genes in C1 and C3 are identified as robustly co-expressed; C: Scatter plots show the median expression of metabolic genes in each sample and group them into four subtypes; D: Kaplan-Meier survival analysis of patients in metabolic subtypes. Log-rank test P values are shown; E: Heatmap depicts the expression of co-expressed metabolic genes across each subgroup.
- Citation: Zou JY, Huang YJ, He J, Tang ZX, Qin L. Glycolytic and fatty acid oxidation genes affect the treatment and prognosis of liver cancer. World J Clin Cases 2022; 10(15): 4737-4760
- URL: https://www.wjgnet.com/2307-8960/full/v10/i15/4737.htm
- DOI: https://dx.doi.org/10.12998/wjcc.v10.i15.4737


