Copyright
©The Author(s) 2022.
World J Clin Cases. Apr 26, 2022; 10(12): 3720-3728
Published online Apr 26, 2022. doi: 10.12998/wjcc.v10.i12.3720
Published online Apr 26, 2022. doi: 10.12998/wjcc.v10.i12.3720
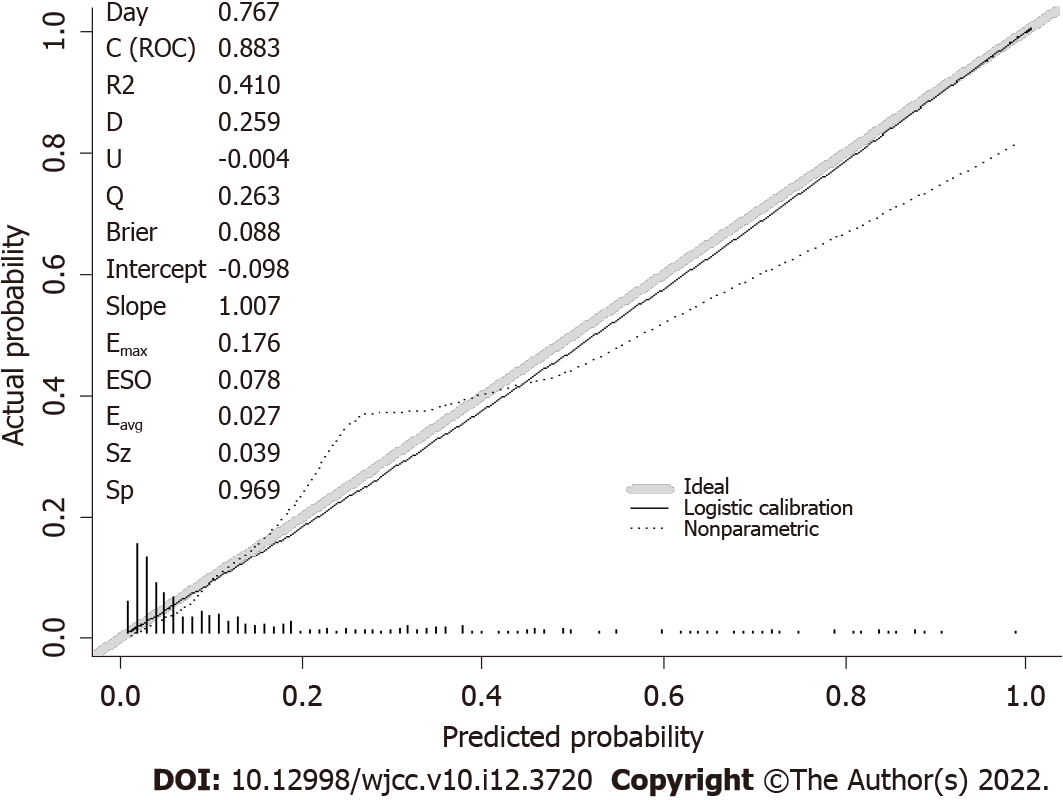
Figure 4 Calibration plot.
A calibration plot compares the model’s predicted probabilities and observed proportions. The diagonal line reflects the ideal situation (predicted probability = observed proportion). The curve represents the relation nonparametrically. The calibration curve is a straight line with a slope close to 1, indicating that this model predicts postoperative complication risk in elderly total hip replacement patients consistent with the actual risk.
- Citation: Tan XJ, Gu XX, Ge FM, Li ZY, Zhang LQ. Nomogram to predict postoperative complications in elderly with total hip replacement. World J Clin Cases 2022; 10(12): 3720-3728
- URL: https://www.wjgnet.com/2307-8960/full/v10/i12/3720.htm
- DOI: https://dx.doi.org/10.12998/wjcc.v10.i12.3720


