Copyright
©The Author(s) 2022.
World J Clin Cases. Apr 16, 2022; 10(11): 3414-3425
Published online Apr 16, 2022. doi: 10.12998/wjcc.v10.i11.3414
Published online Apr 16, 2022. doi: 10.12998/wjcc.v10.i11.3414
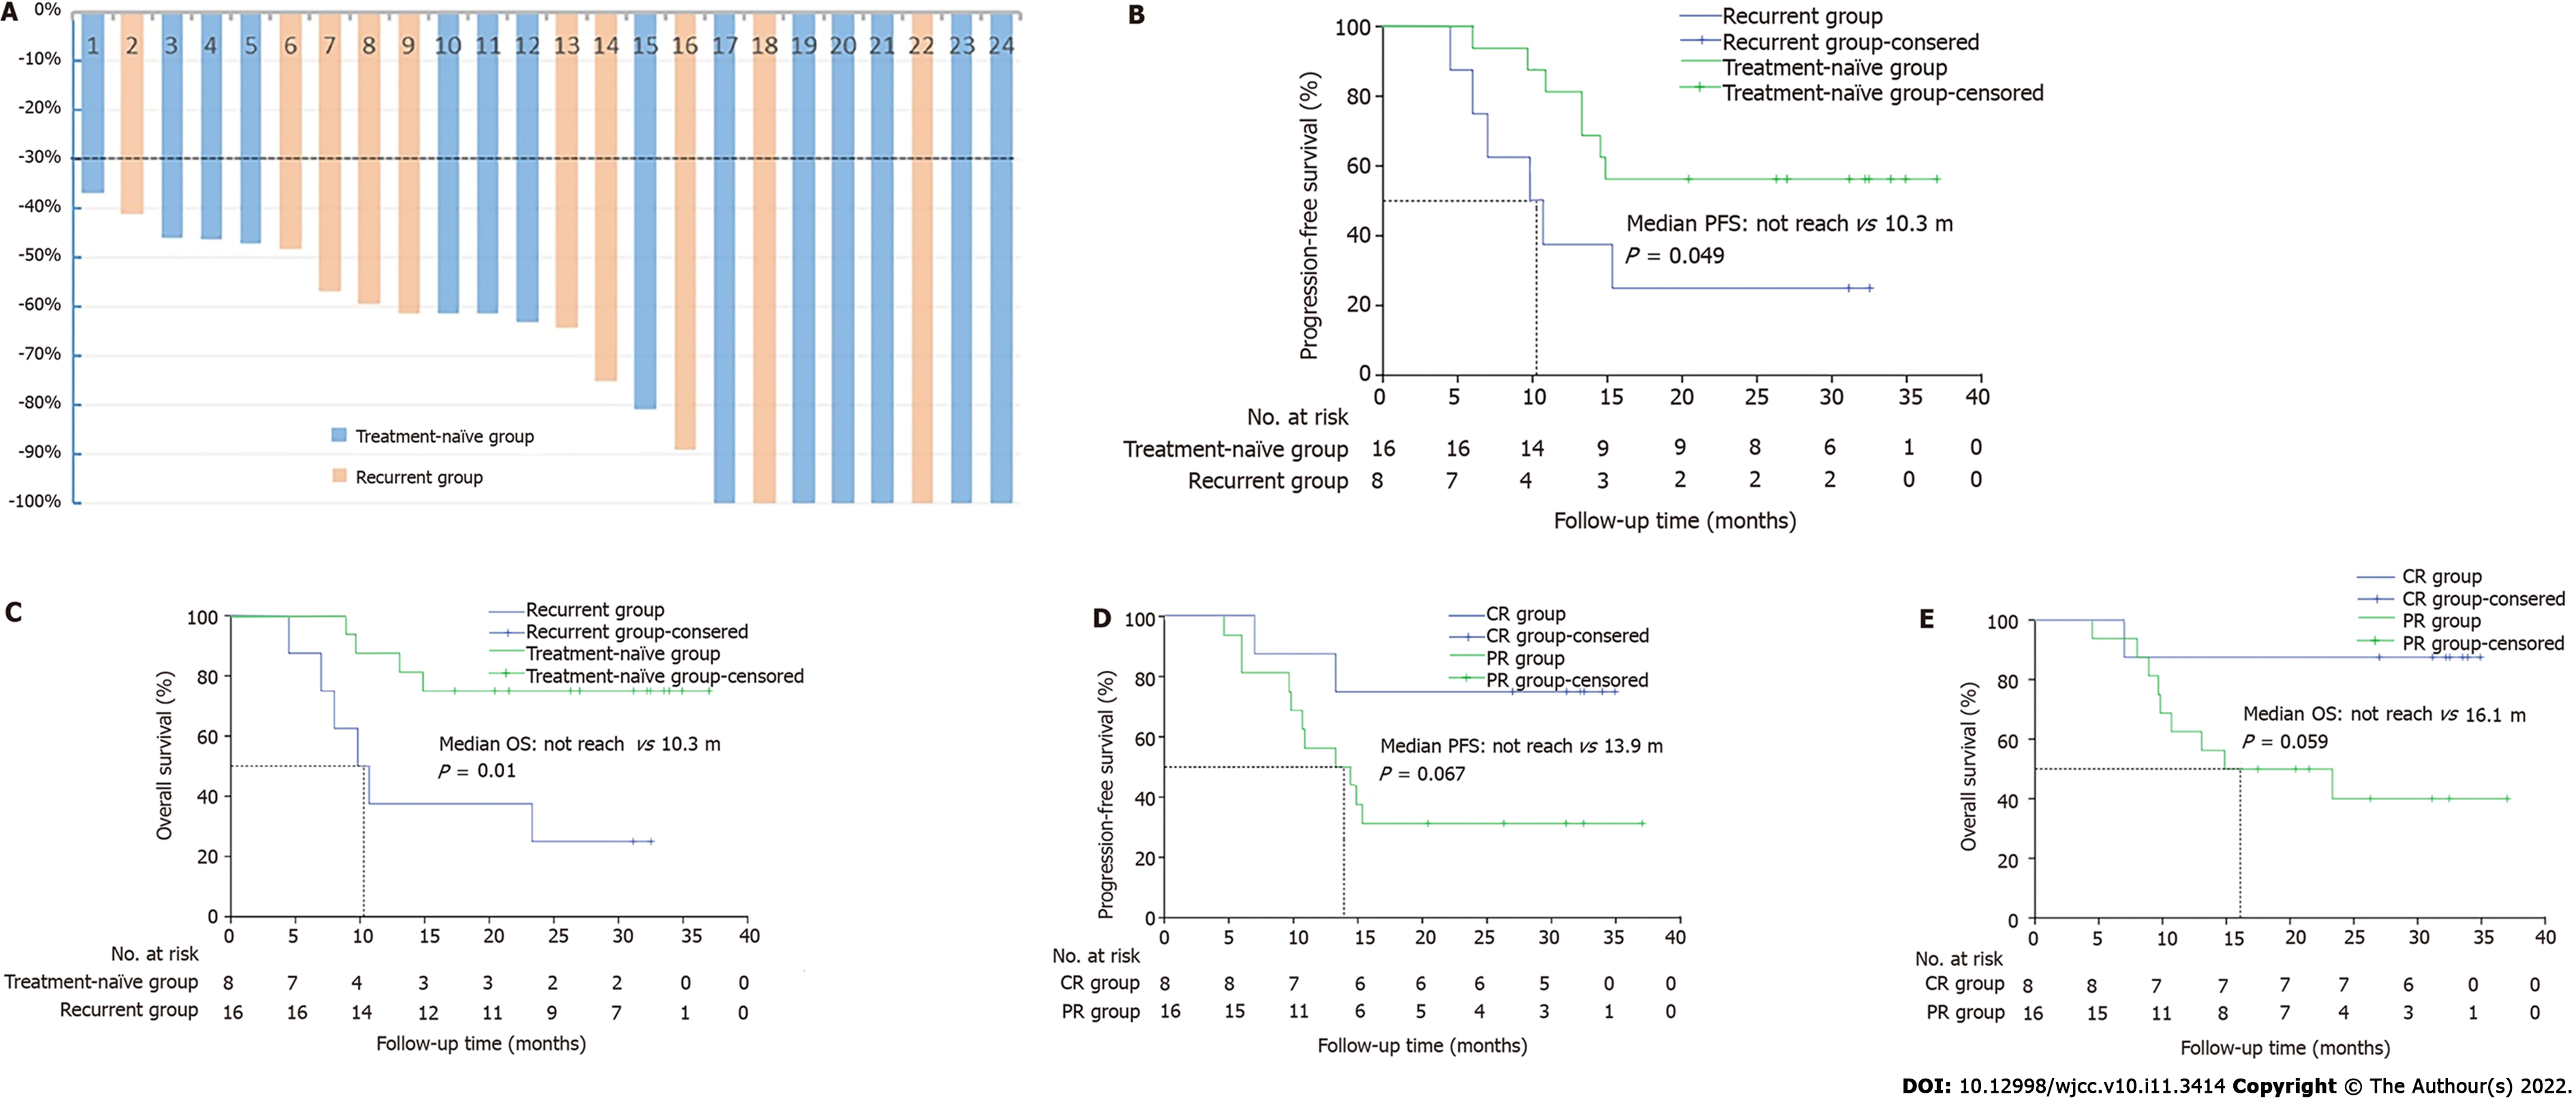
Figure 3 Subgroup analysis.
A: Regression ratio of tumor diameter per case; B and C: Kaplan–Meier curve of progressionfree survival (PFS) (B) and overall survival (C) between recurrent subgroup and treatment-naïve subgroup; D and C: Kaplan–Meier curve of PFS (D) and OS (E) between complete response subgroup and partial response subgroup.
- Citation: Huo RX, Jin YY, Zhuo YX, Ji XT, Cui Y, Wu XJ, Wang YJ, Zhang L, Zhang WH, Cai YM, Zheng CC, Cui RX, Wang QY, Sun Z, Wang FW. Concurrent chemoradiotherapy using gemcitabine and nedaplatin in recurrent or locally advanced head and neck squamous cell carcinoma. World J Clin Cases 2022; 10(11): 3414-3425
- URL: https://www.wjgnet.com/2307-8960/full/v10/i11/3414.htm
- DOI: https://dx.doi.org/10.12998/wjcc.v10.i11.3414


