Copyright
©The Author(s) 2022.
World J Clin Cases. Apr 16, 2022; 10(11): 3334-3351
Published online Apr 16, 2022. doi: 10.12998/wjcc.v10.i11.3334
Published online Apr 16, 2022. doi: 10.12998/wjcc.v10.i11.3334
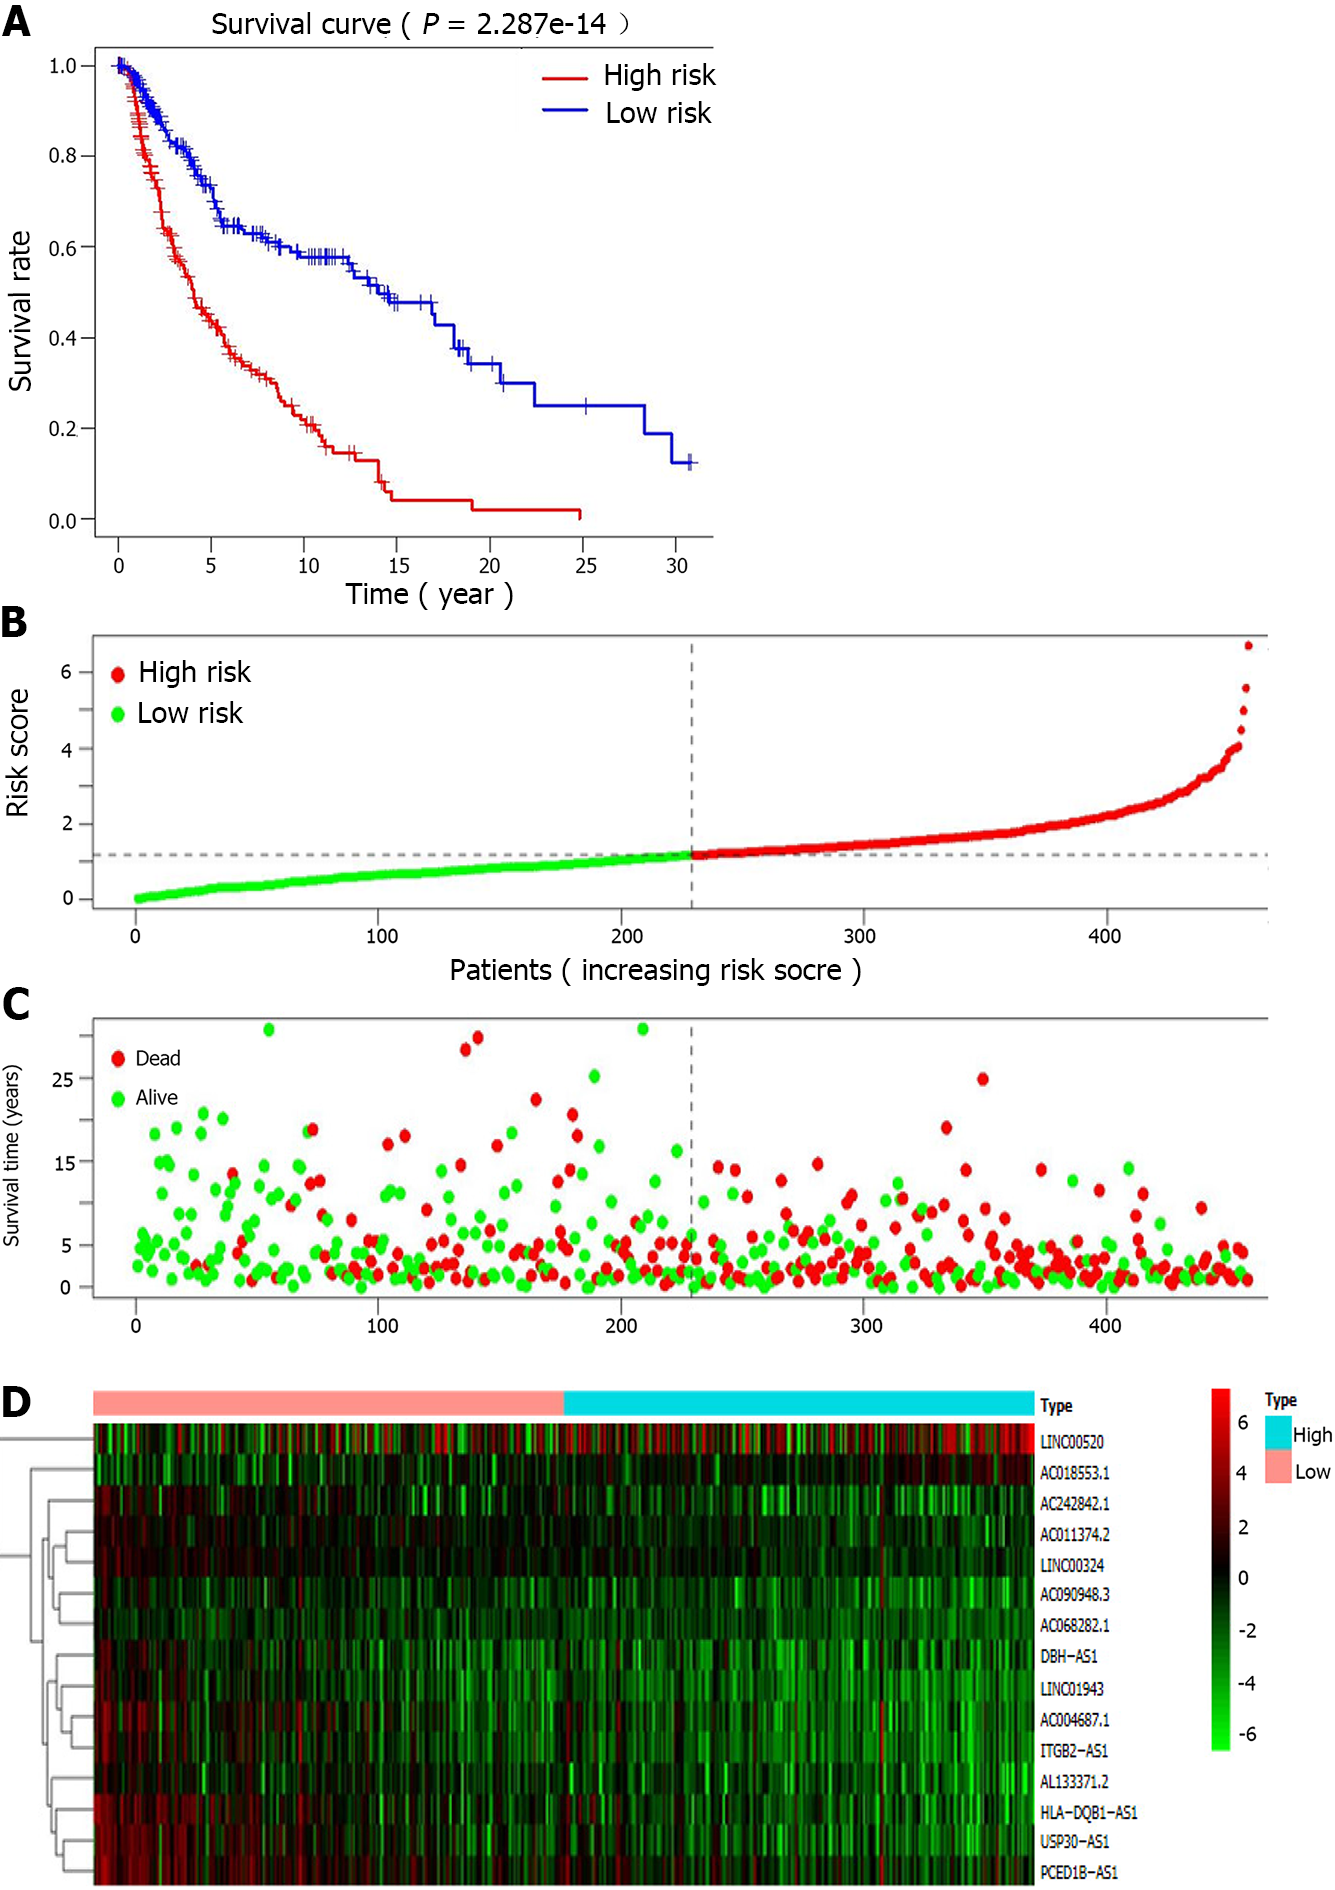
Figure 3 Prognostic value of the 15-lncRNA risk model for melanoma.
A: Survival rate analysis; B: Representative risk curve showing the risk scores; C: Scatter diagram of survival state. Green dots: Surviving; red dots: Dead; D: Representative heatmap showing the expression of indicated lncRNAs in different groups. Green and red represent low and high expression, respectively.
- Citation: Qiu Y, Wang HT, Zheng XF, Huang X, Meng JZ, Huang JP, Wen ZP, Yao J. Autophagy-related long non-coding RNA prognostic model predicts prognosis and survival of melanoma patients. World J Clin Cases 2022; 10(11): 3334-3351
- URL: https://www.wjgnet.com/2307-8960/full/v10/i11/3334.htm
- DOI: https://dx.doi.org/10.12998/wjcc.v10.i11.3334


