Copyright
©The Author(s) 2020.
World J Clin Cases. Jul 6, 2020; 8(13): 2738-2748
Published online Jul 6, 2020. doi: 10.12998/wjcc.v8.i13.2738
Published online Jul 6, 2020. doi: 10.12998/wjcc.v8.i13.2738
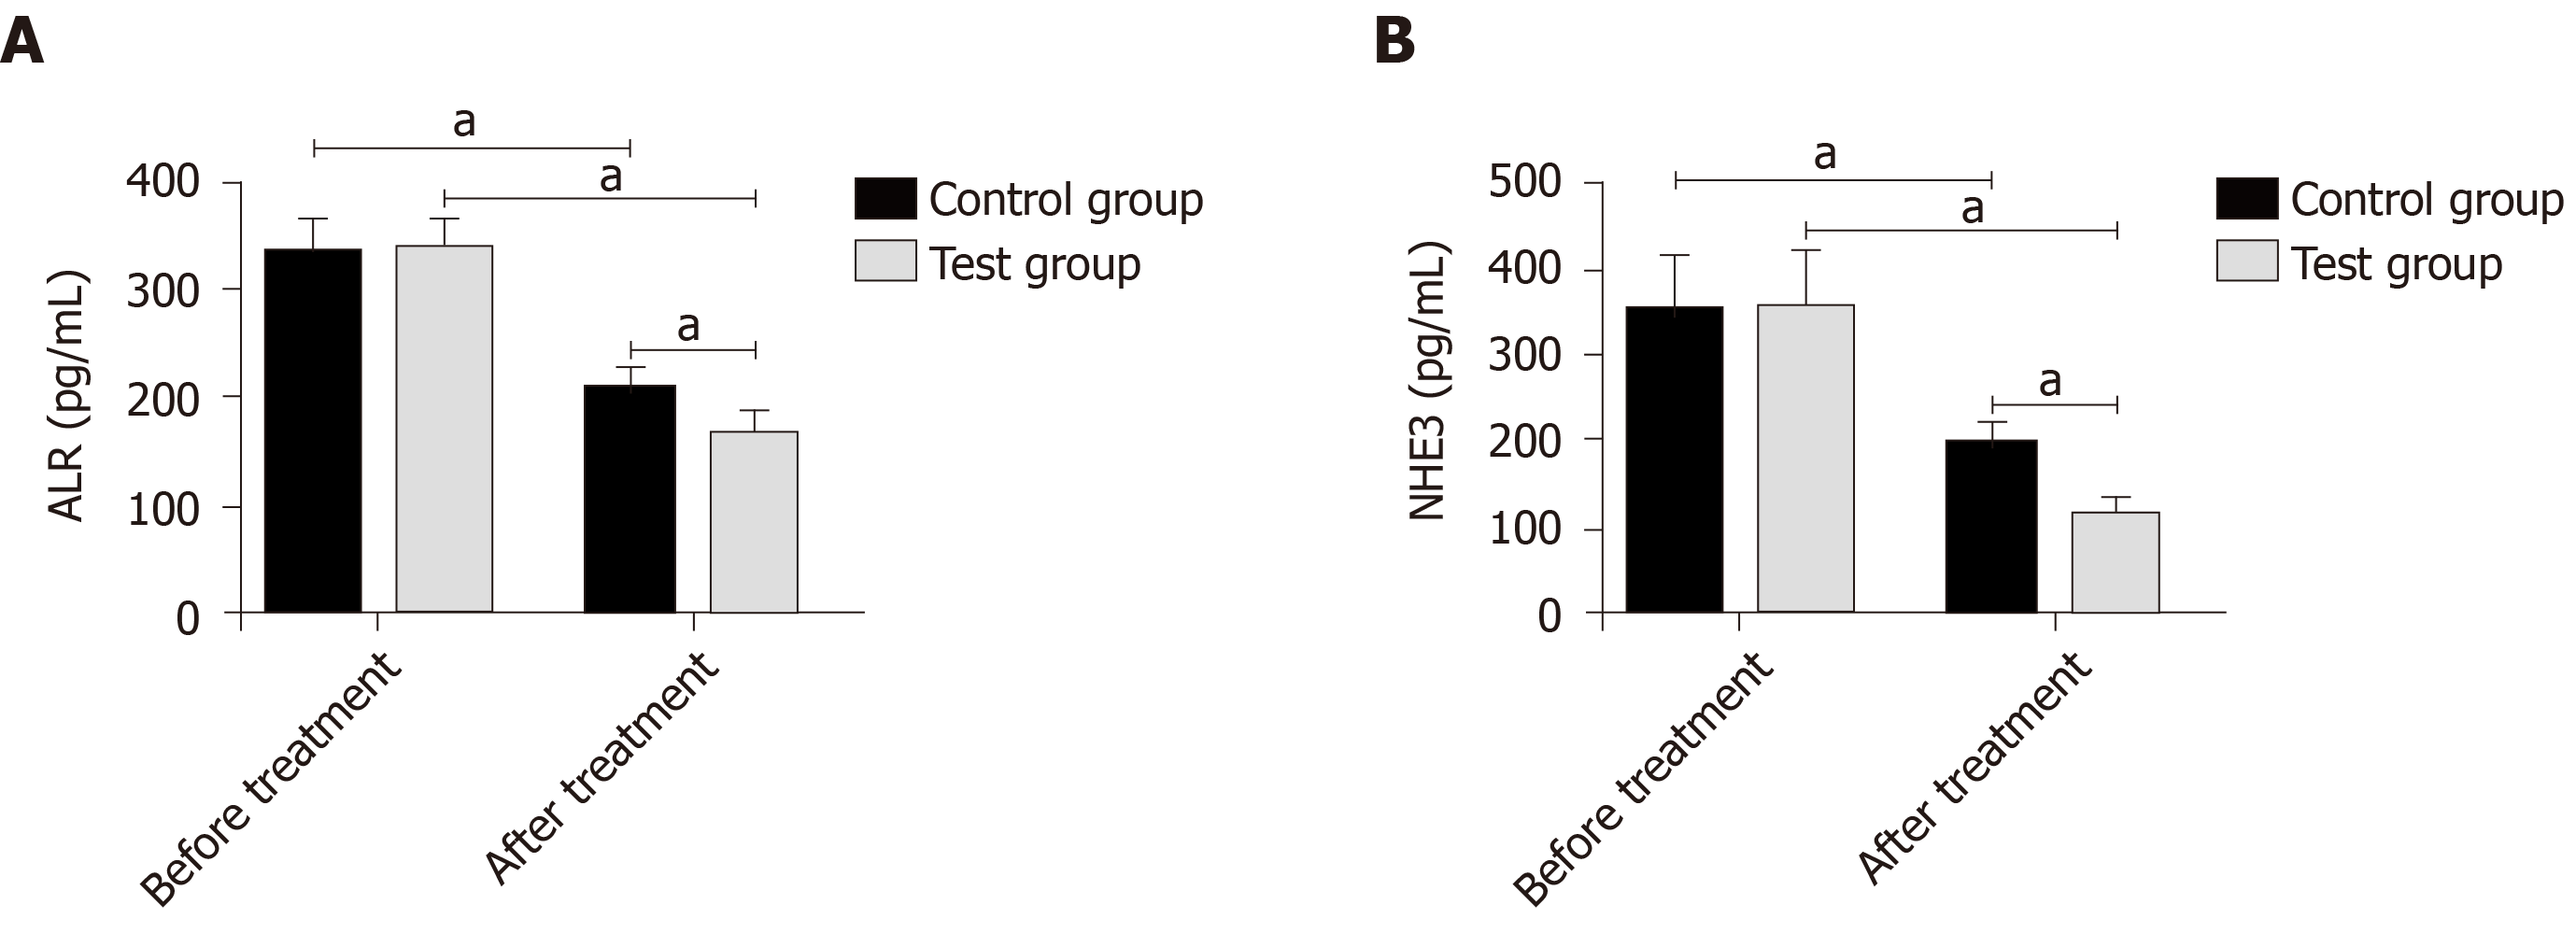
Figure 1 Comparison of urinary augmenter of liver regeneration and Na+/H+ exchanger 3.
A: Before treatment, urinary augmenter of liver regeneration levels in the control and experimental groups were approximately the same. After treatment, the levels in all subjects decreased, and the decrease in the experimental group was more significant than that in the control group; B: Before treatment, urinary Na+/H+ exchanger 3 levels in the control and experimental groups were approximately the same. After treatment, the levels in all subjects decreased, and the decrease in the experimental group was more significant than that in the control group. aP < 0.05. ALR: Augmenter of liver regeneration; NEH3: Na+/H+ exchanger 3.
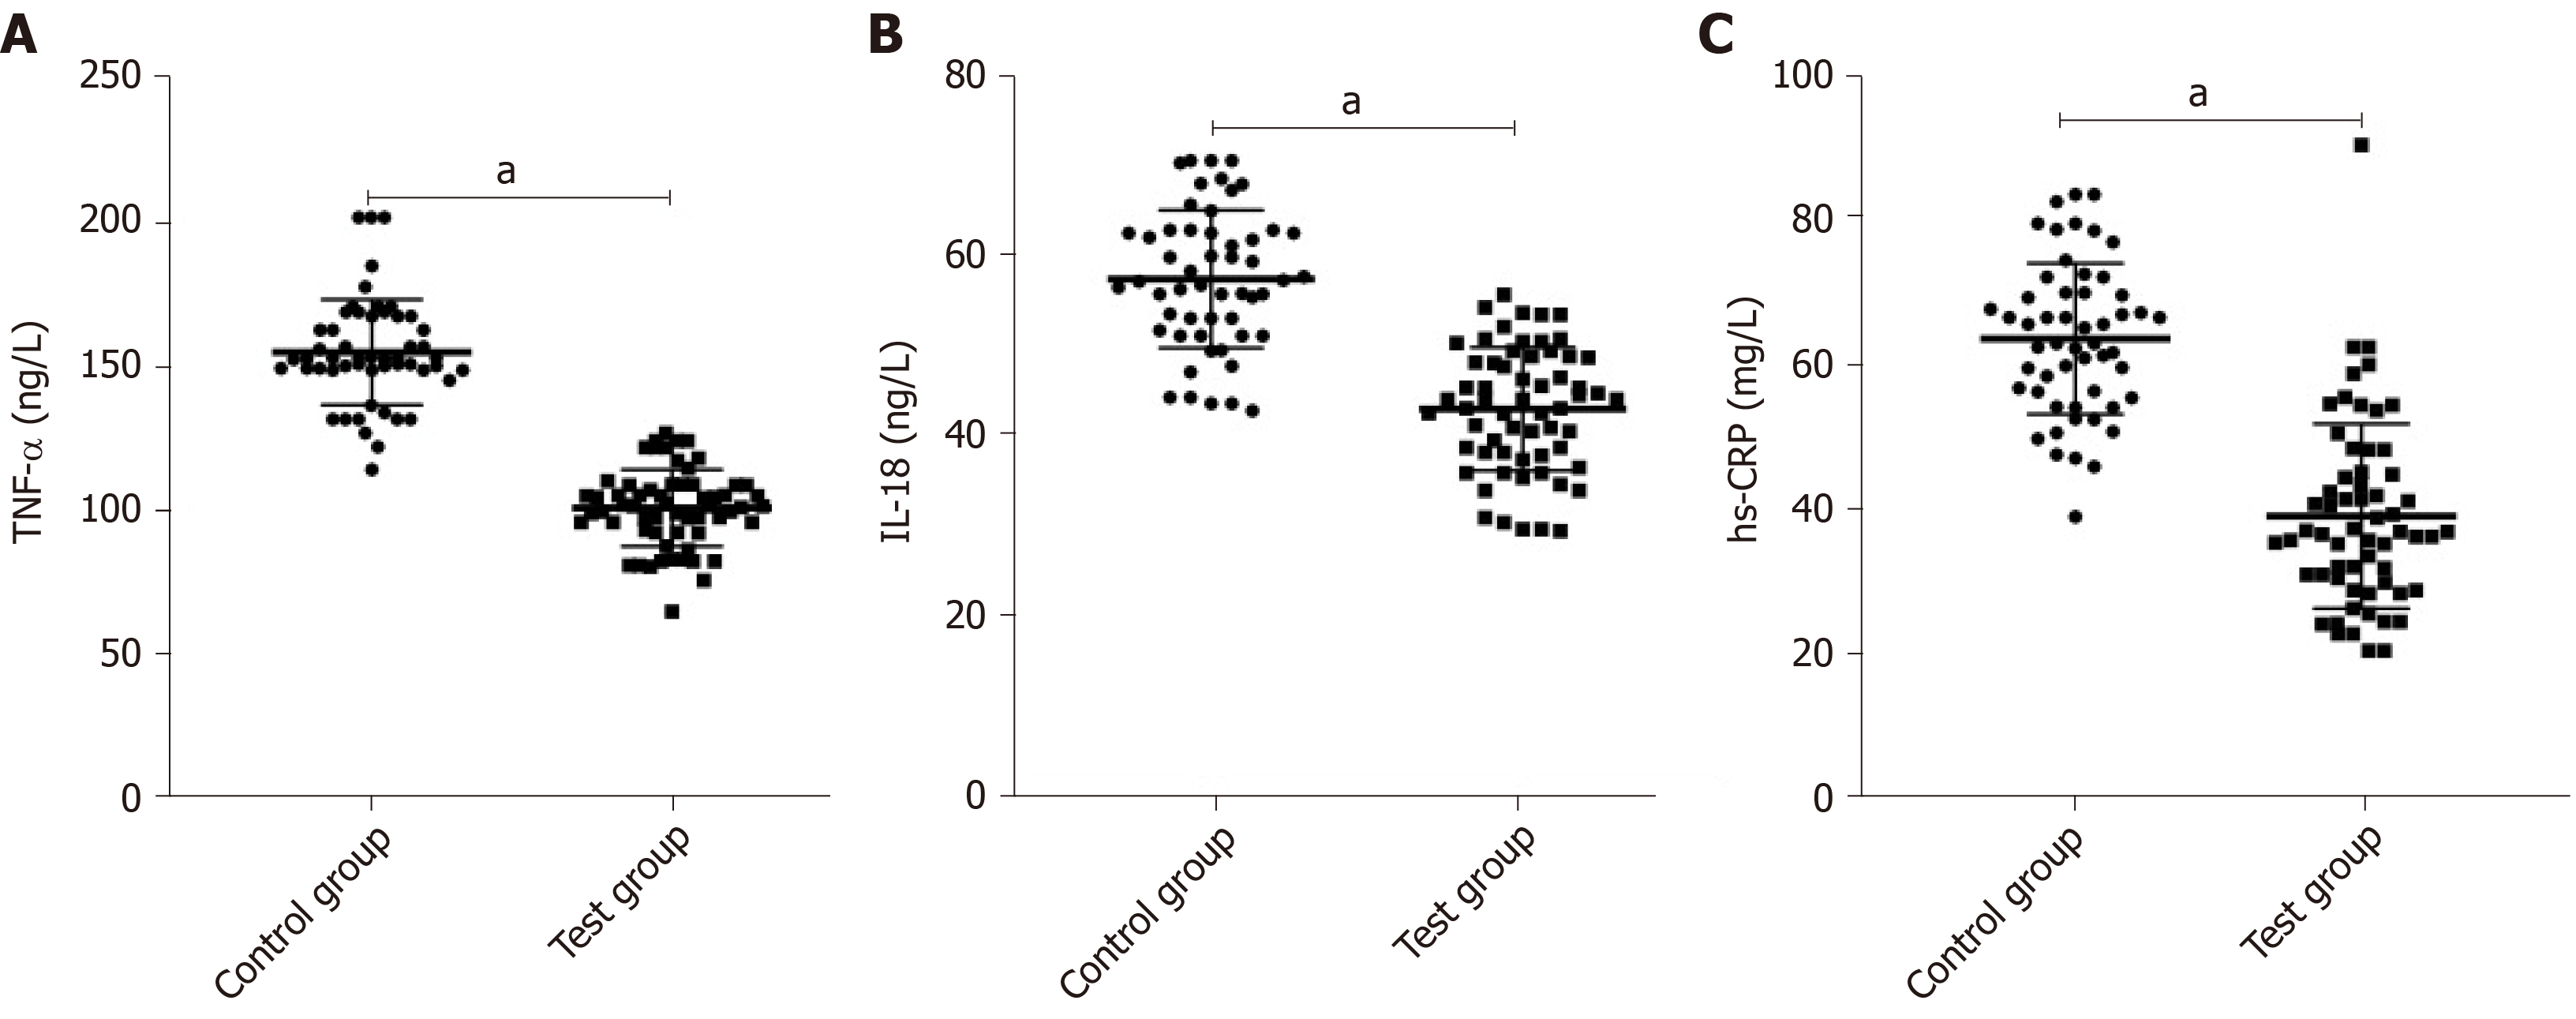
Figure 2 Comparison of serum inflammatory cytokines.
A: After treatment, tumor necrosis factor-α level in the experimental group was significantly lower than that in the control group; B: After treatment, interleukin-18 level in the experimental group was significantly lower than that in the control group; C: After treatment, high-sensitivity C-reactive protein level in the experimental group was significantly lower than that in the control group. aP < 0.05. TNF-α: Tumor necrosis factor-α; IL-18: Interleukin-18; hs-CRP: High sensitivity C-reactive protein.
Figure 3 Comparison of renal function indices.
A: Before treatment, blood urea nitrogen level in the control group was about the same as that in the experimental group. After treatment, the levels in all subjects increased, but the increase in the experimental group was smaller than that in the control group; B: Before treatment, serum creatinine level in the control group was about the same as that in the experimental group. After treatment, the levels in all subjects increased, but the increase in the experimental group was smaller than that in the control group. aP < 0.05. BUN: Blood urea nitrogen; SCr: Serum creatinine.
Figure 4 Comparison of immune function indices.
A: Before treatment, CD3+ T lymphocytes in the control and experimental groups were approximately the same. After treatment, the index in all subjects increased, and the increase in the experimental group was more significant than that in the control group; B: Before treatment, CD4+ T lymphocytes in the control and experimental groups were approximately the same. After treatment, the index in all subjects increased, and the increase in the experimental group was more significant than that in the control group; C: Before treatment, CD4+/CD8+ T lymphocyte ratios in the control and experimental groups were approximately the same. After treatment, the index in all subjects increased, and the increase in the experimental group was more significant than that in the control group. aP < 0.05.
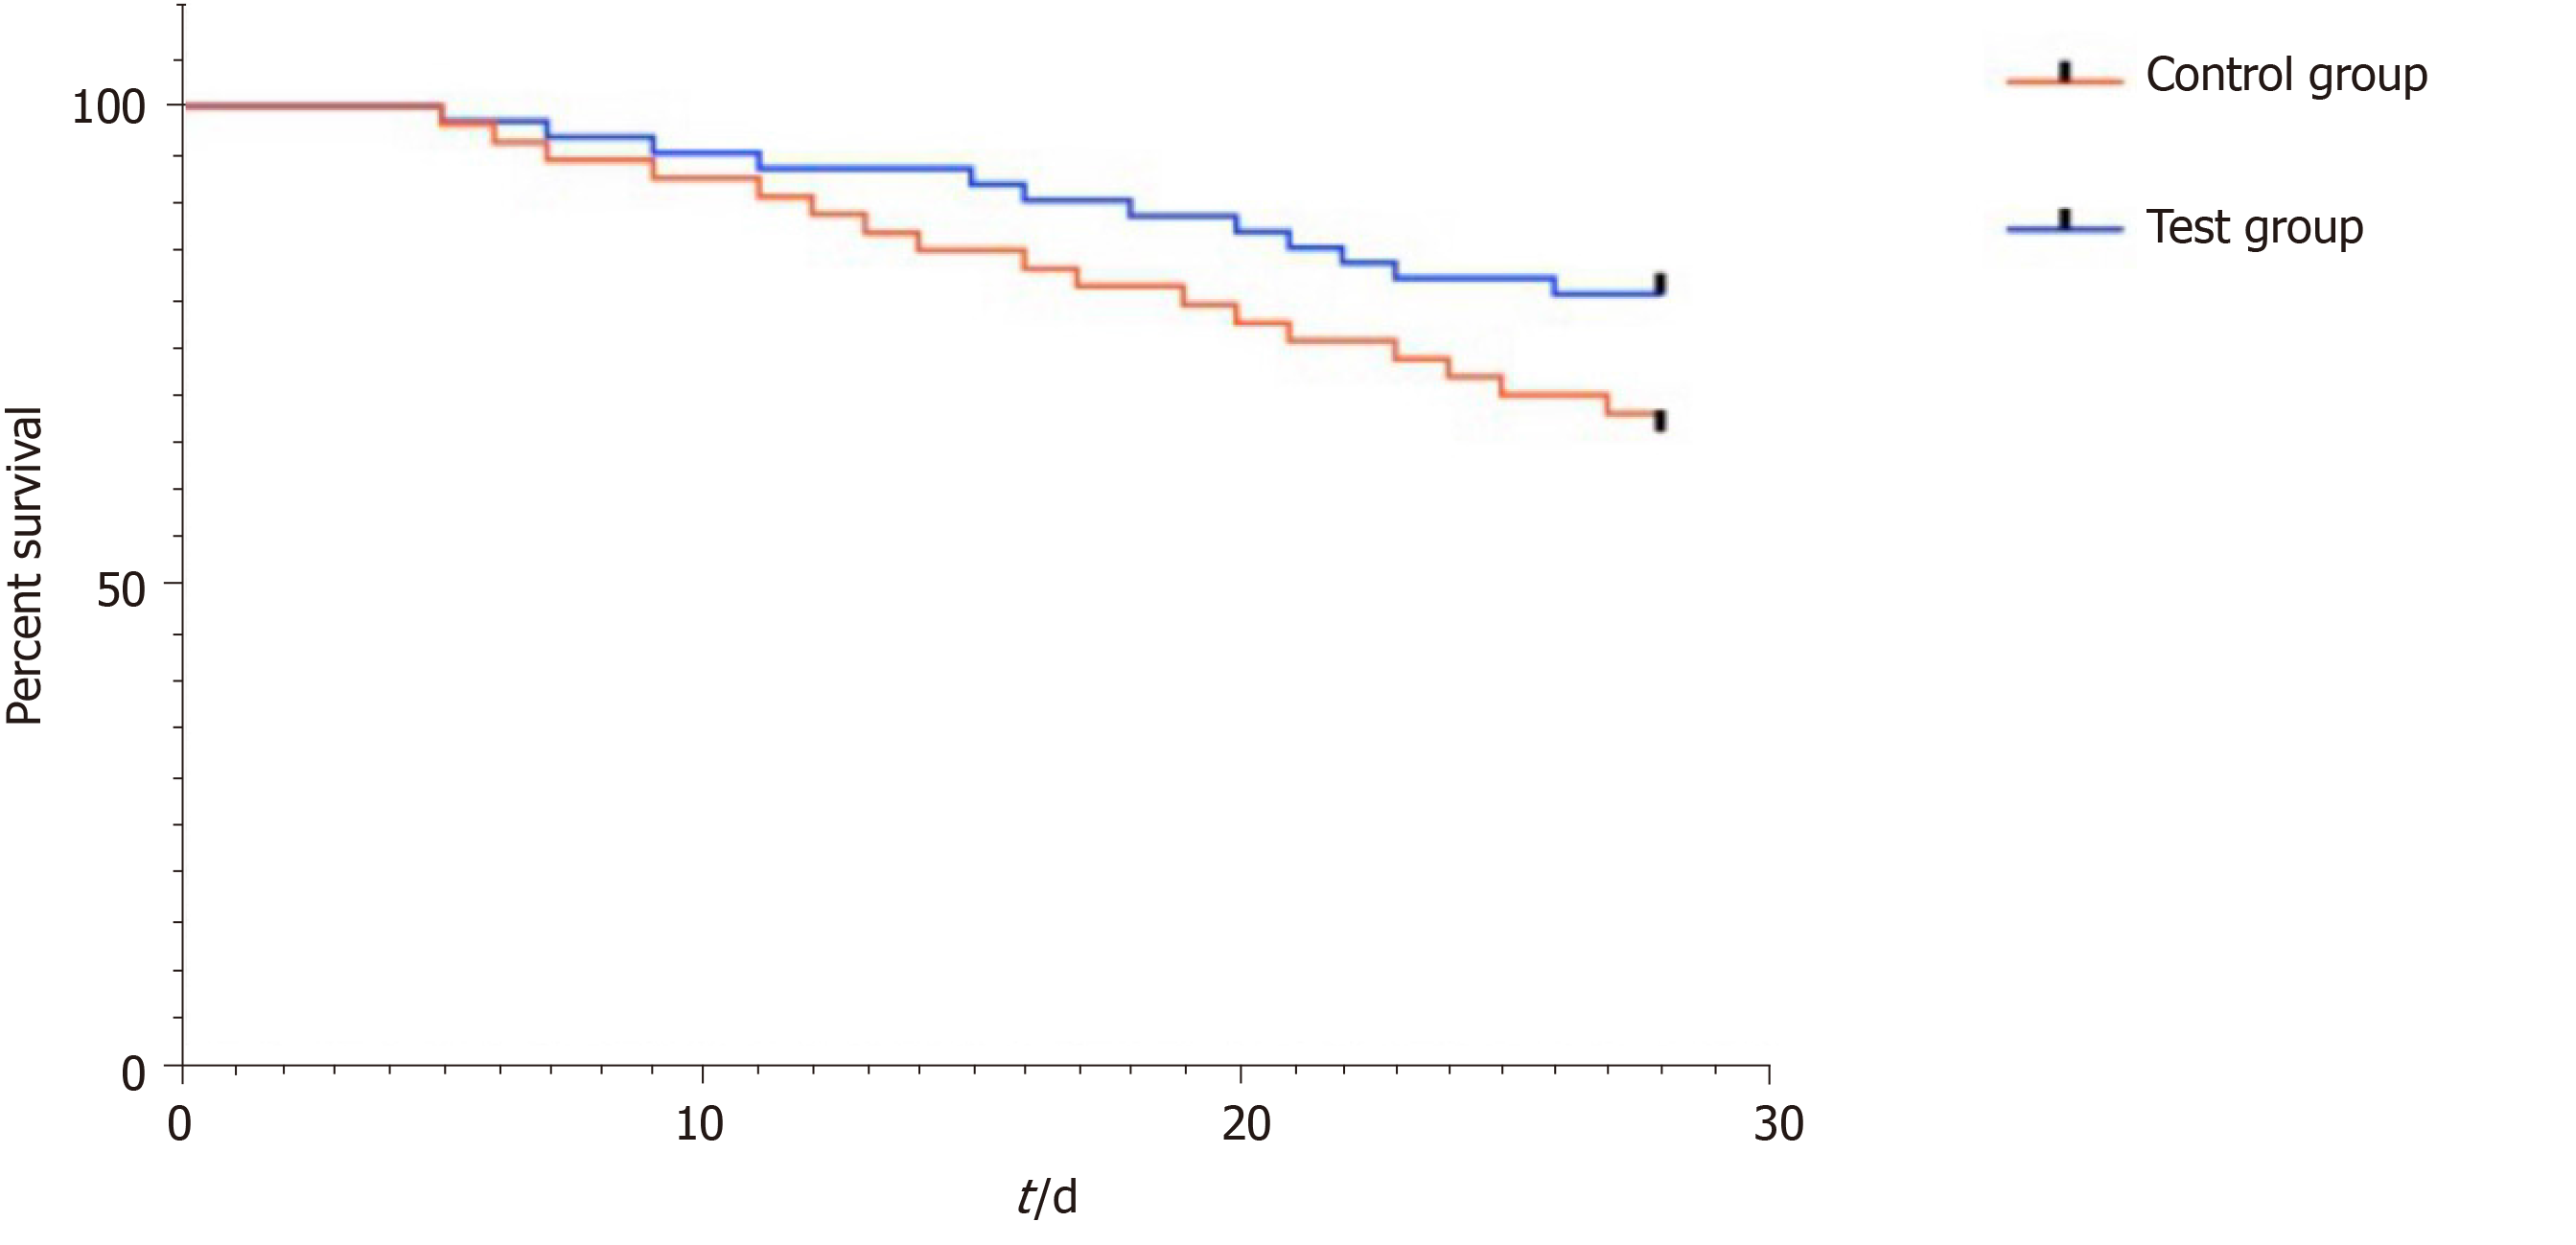
Figure 5 Comparison of death within 28 d after treatment.
The K-M survival curve shows that the 28-d survival rate in the experimental group (80.33%) was significantly higher than that in the control group (66.04%).
- Citation: Lei L, Wang MJ, Zhang S, Hu DJ. Effects of prostaglandin E combined with continuous renal replacement therapy on septic acute kidney injury. World J Clin Cases 2020; 8(13): 2738-2748
- URL: https://www.wjgnet.com/2307-8960/full/v8/i13/2738.htm
- DOI: https://dx.doi.org/10.12998/wjcc.v8.i13.2738


