Copyright
©The Author(s) 2019.
World J Clin Cases. Nov 6, 2019; 7(21): 3622-3631
Published online Nov 6, 2019. doi: 10.12998/wjcc.v7.i21.3622
Published online Nov 6, 2019. doi: 10.12998/wjcc.v7.i21.3622
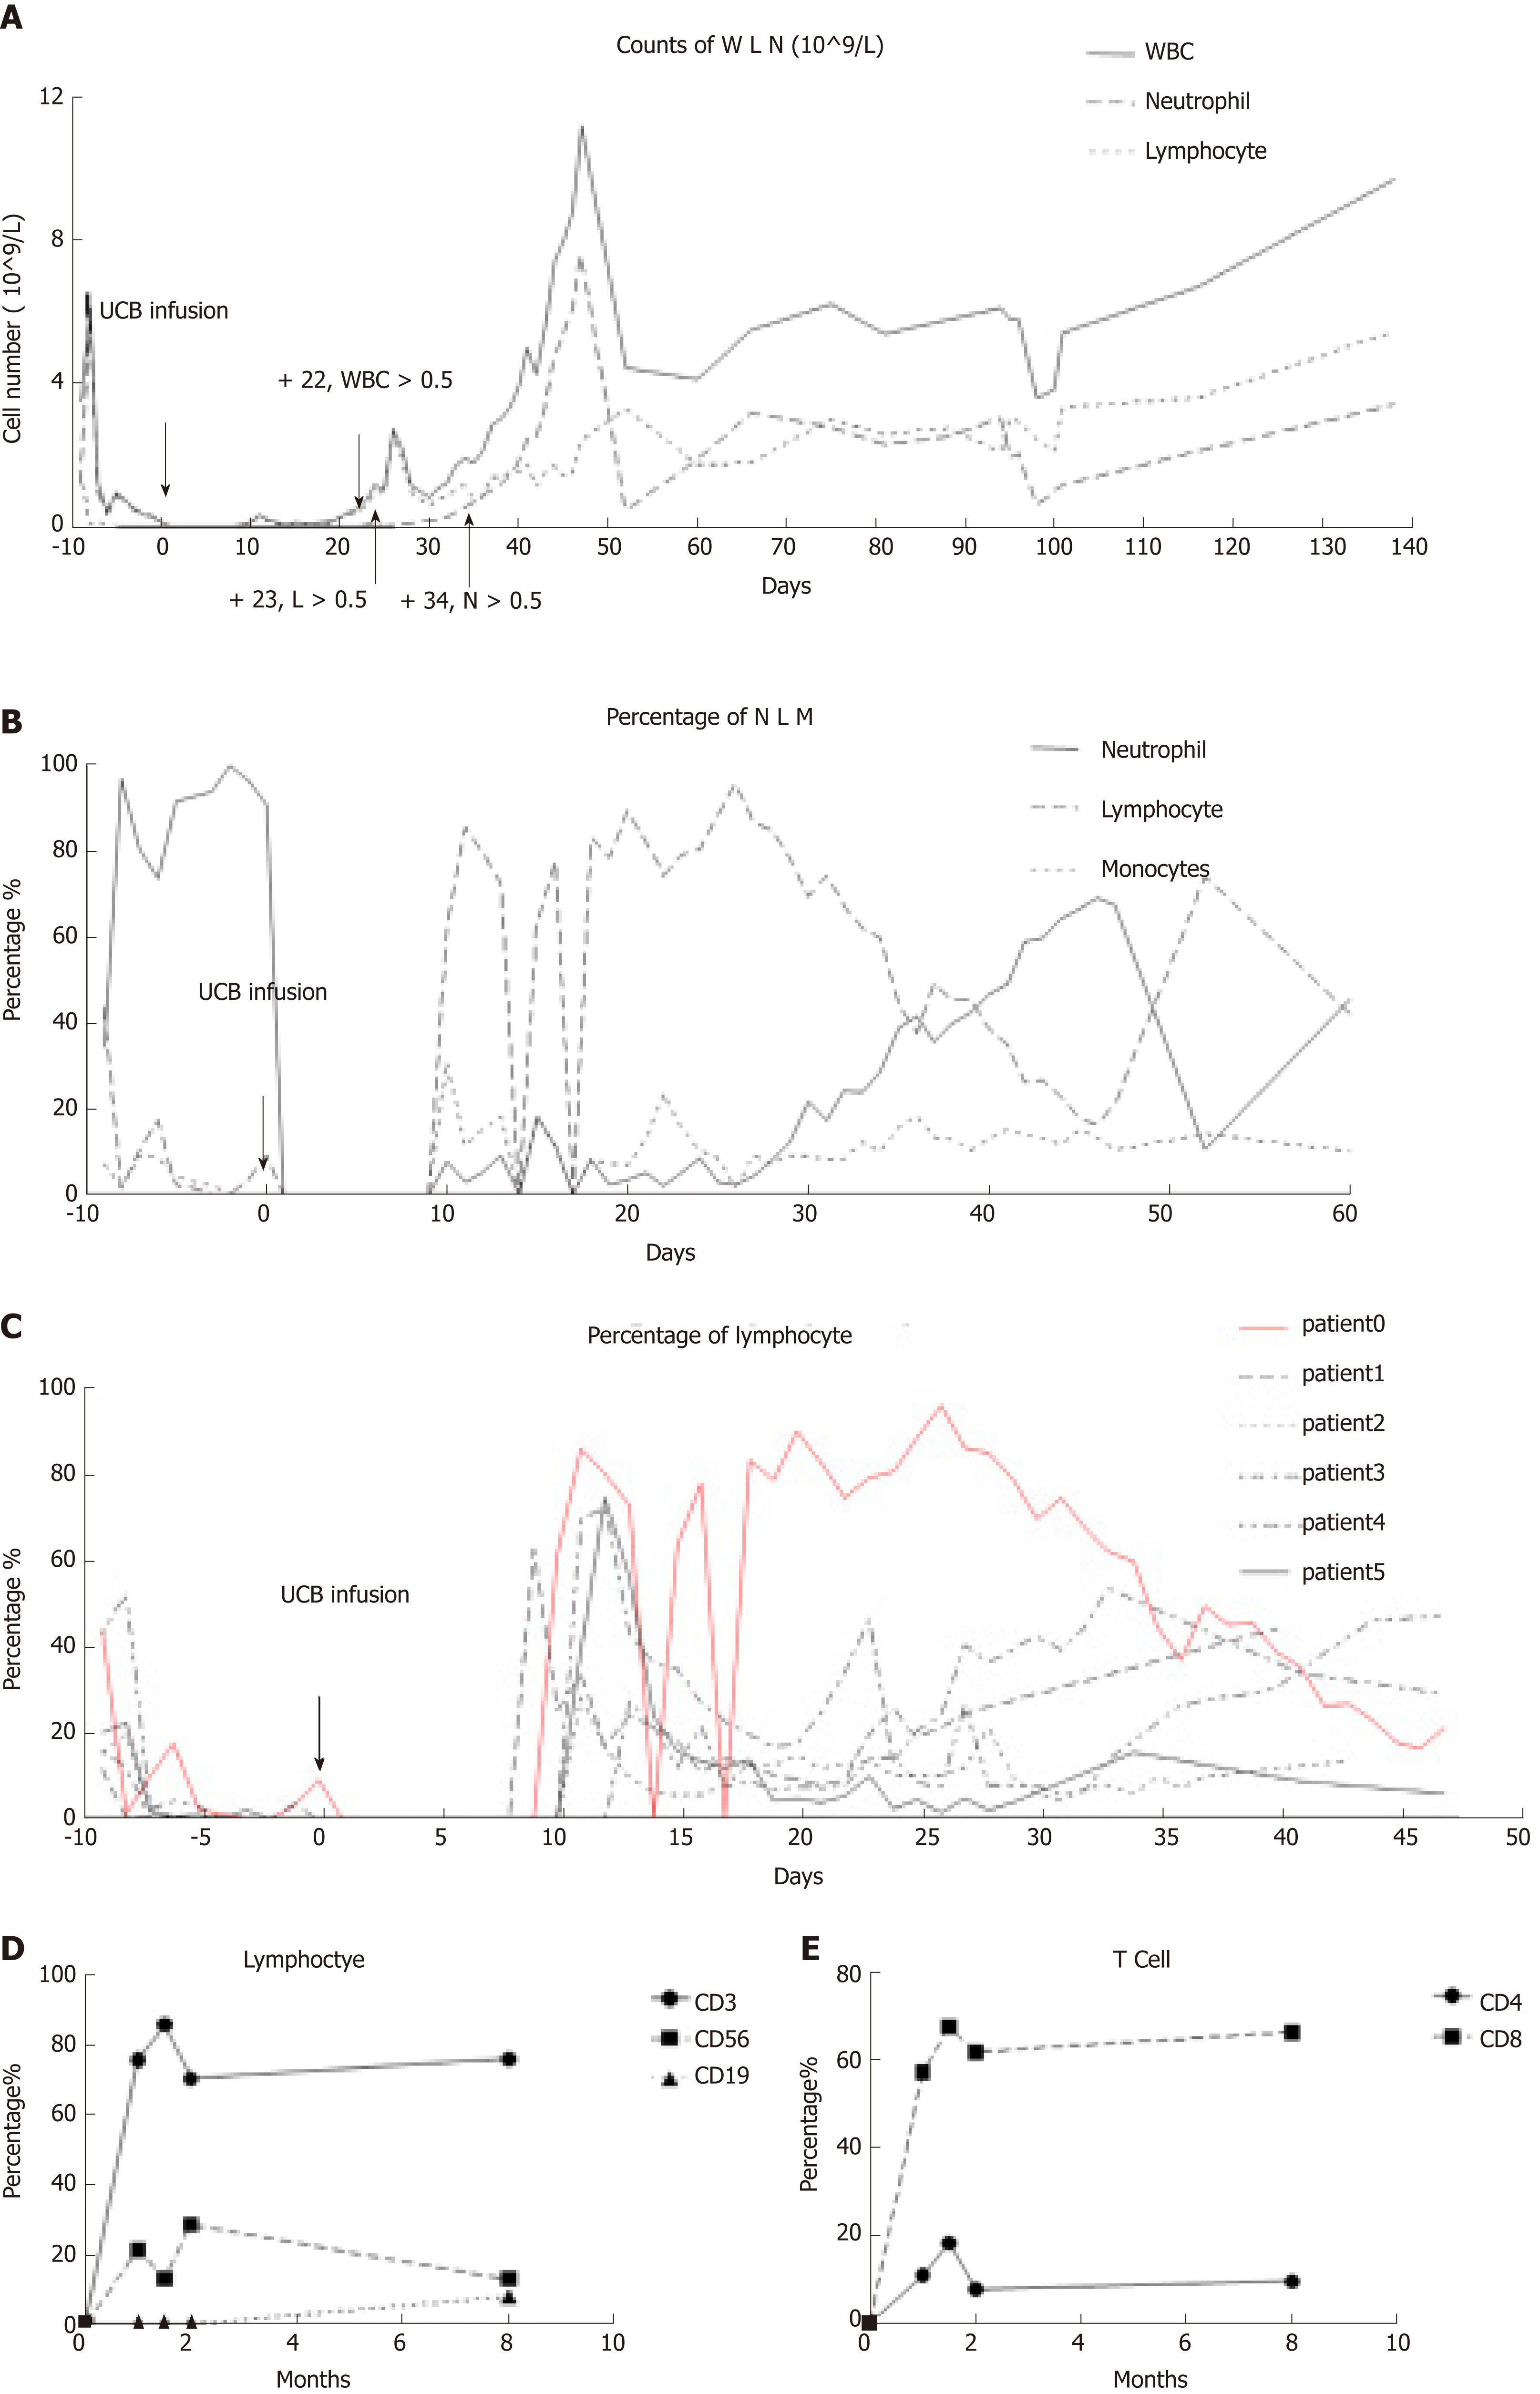
Figure 1 WBC changes after transplantation.
A: Counts of WBCs, lymphocytes and neutrophils after UCB infusion. Counts of WBCs, lymphocytes and neutrophils changed and fluctuated near normal levels. WBC count reached 0.5 × 10⁹ on day 22, lymphocytes reached 0.5 × 10⁹ on day 23, and neutrophils reached 0.5 × 10⁹ on day 34; B: Percentage of neutrophils, lymphocytes and monocytes fluctuated near normal levels. The percentage of lymphocytes was high within 1 mo after transplantation; C: Changes in lymphocyte subsets after transplantation. The main subsets of lymphocytes in this patient were T cells; D: Changes in T cell subsets after transplantation. The main subgroup of T cells in this patient was CD4+ T cells; E: Percentage of lymphocytes from day −10 to day 50. After UCB infusion, percentage of lymphocytes changed and fluctuated near normal levels in different patients. UCB: Umbilical cord blood; WBC: White blood cell.
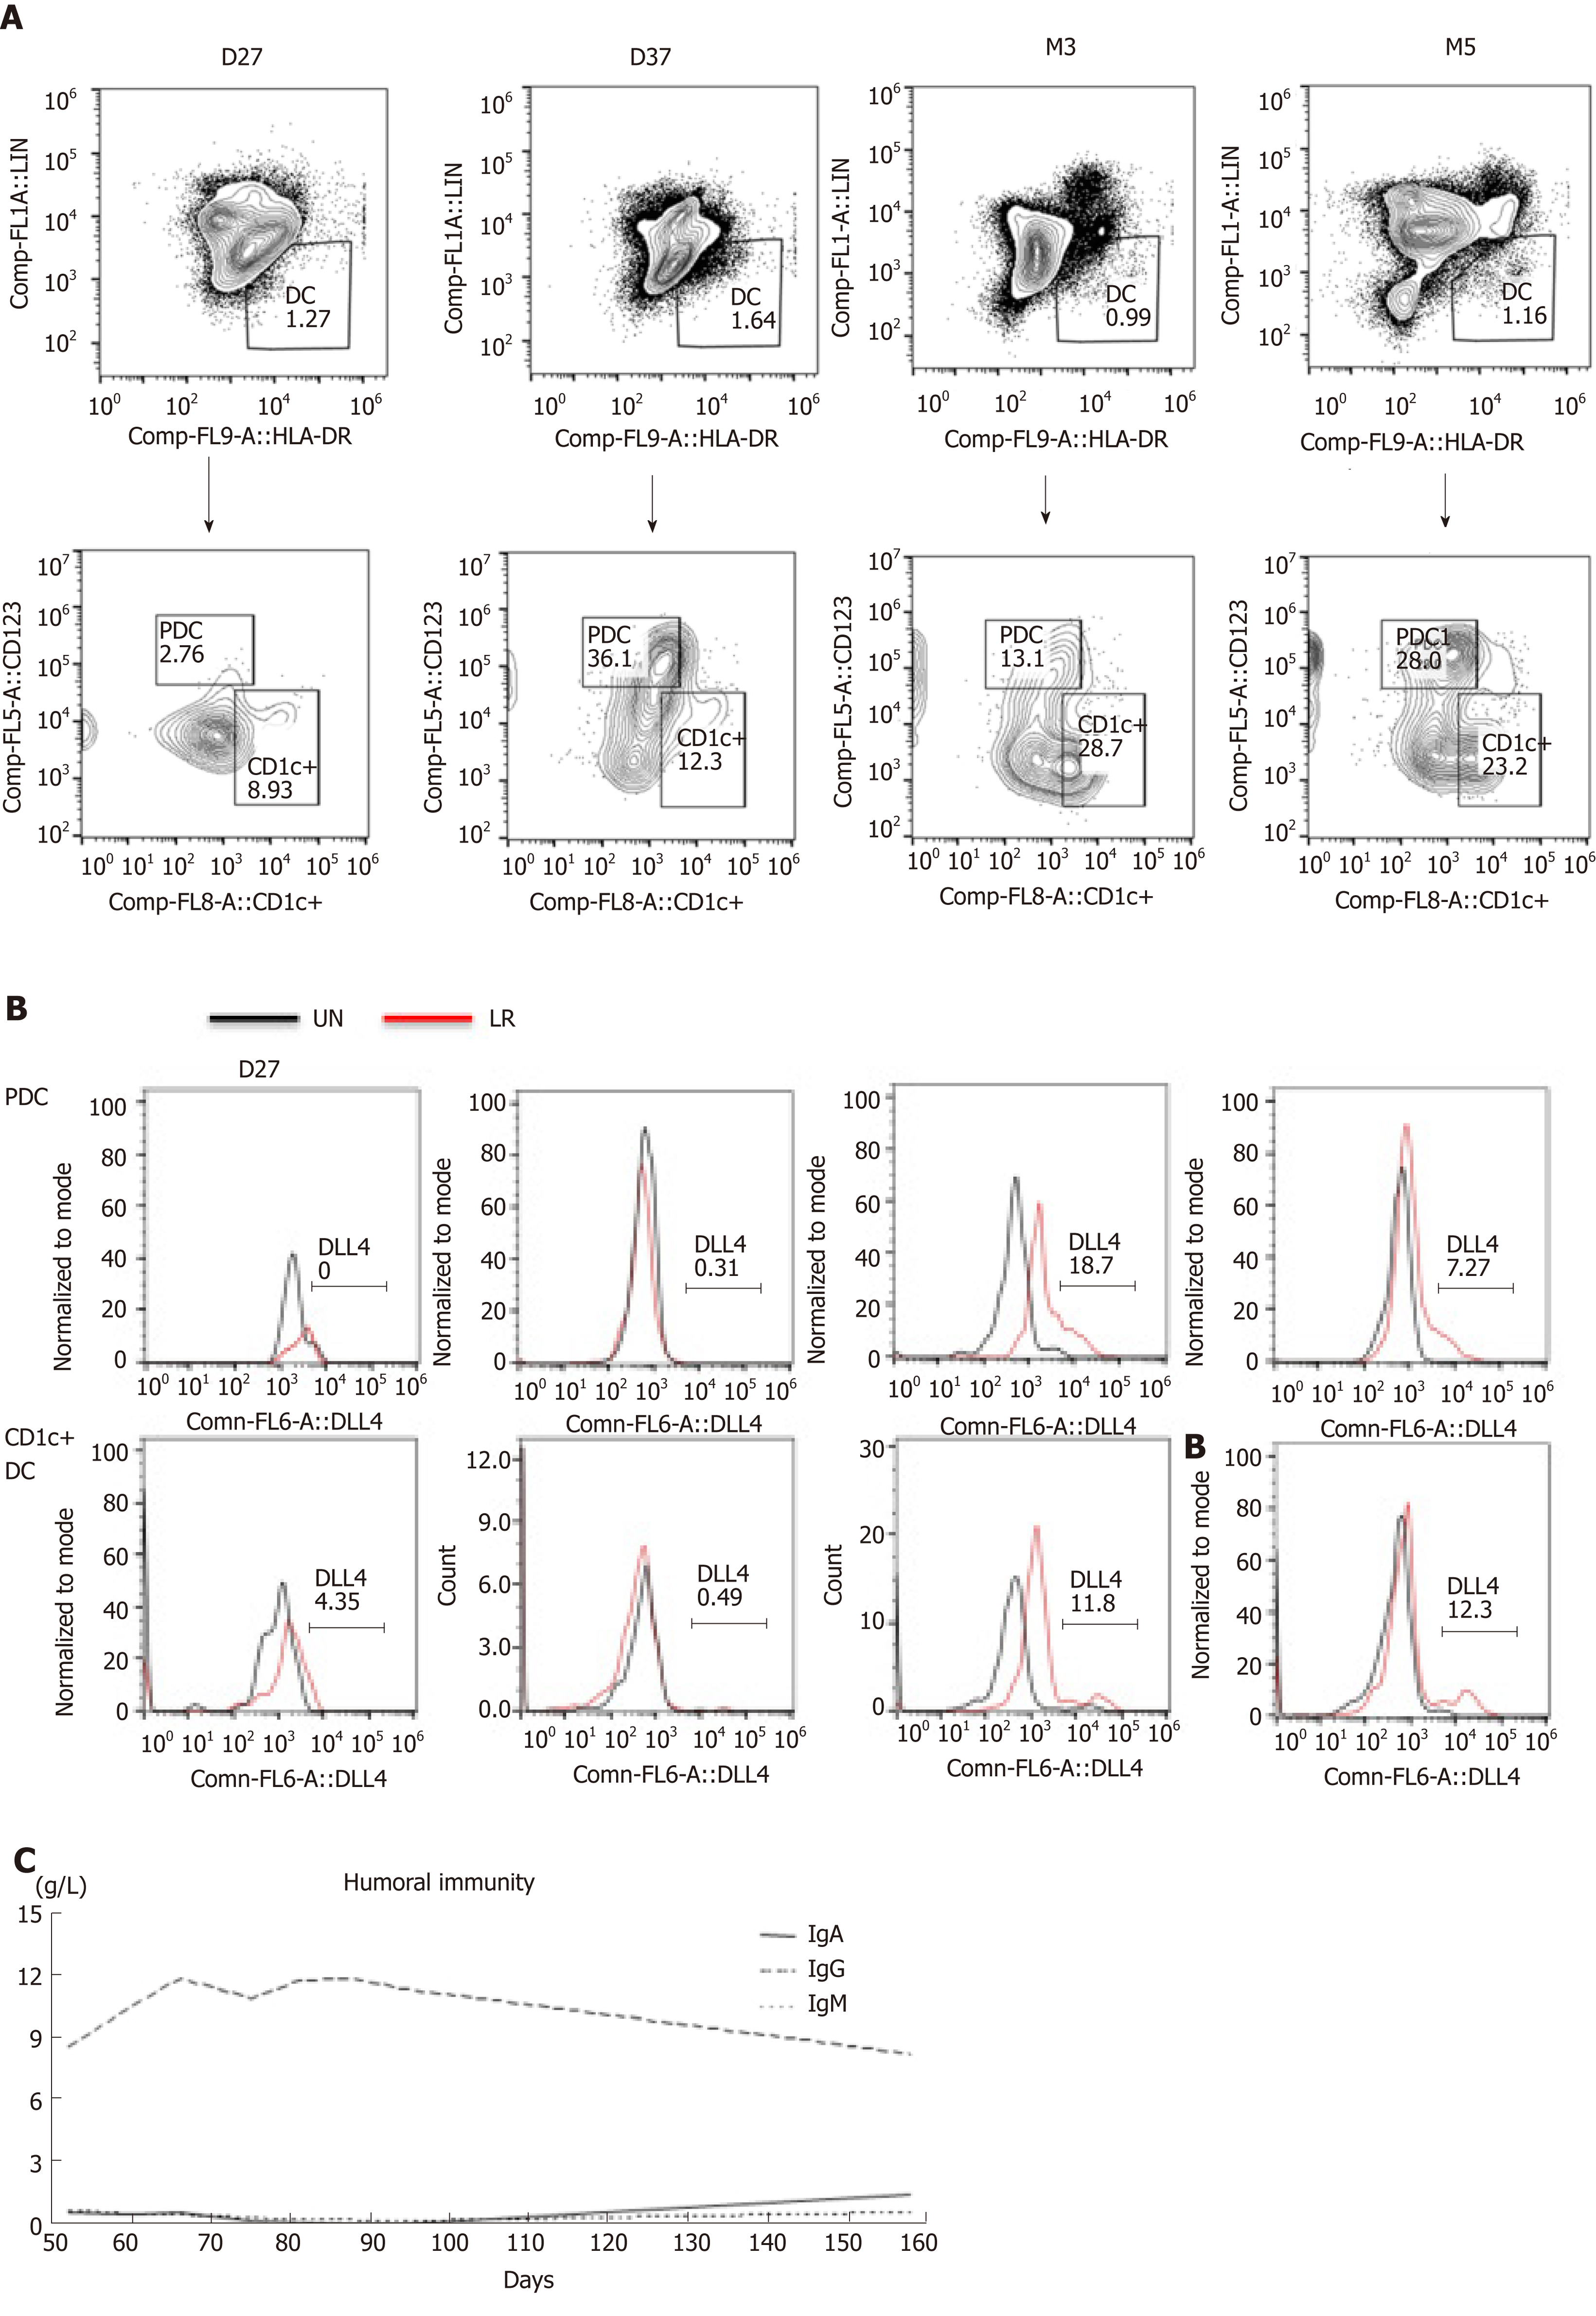
Figure 2 Reconstitution of DCs.
A: Percentage of DCs and DC subsets day 27 to month 5. After UCB infusion, percentage of DCs, pDCs and CD1c+ DCs increased. DCs, lineage-HLA-DR+; plasmacytoid DCs, lineage-HLA-DR+CD123+; CD1c+ DCs, lineage-HLA-DR+CD1c+, detected by flow cytometry; B: DC changes after transplantation. Total DC reconstitution after transplantation; C: DC subset changes after transplantation. pDC and CD1c+ conventional DC reconstitution after transplantation; D: Delta-like protein 4 (DLL4+) DC changes after transplantation. After UCB infusion from day 27 to month 5, percentage of DLL4+ pDCs and DLL4+ CD1c+ DCs detected by flow cytometry after LPS (0.1 μg/mL) + R848 (0.1 μg/mL) stimulation for 24 h. DC: Dendritic cell; UCB: Umbilical cord blood.
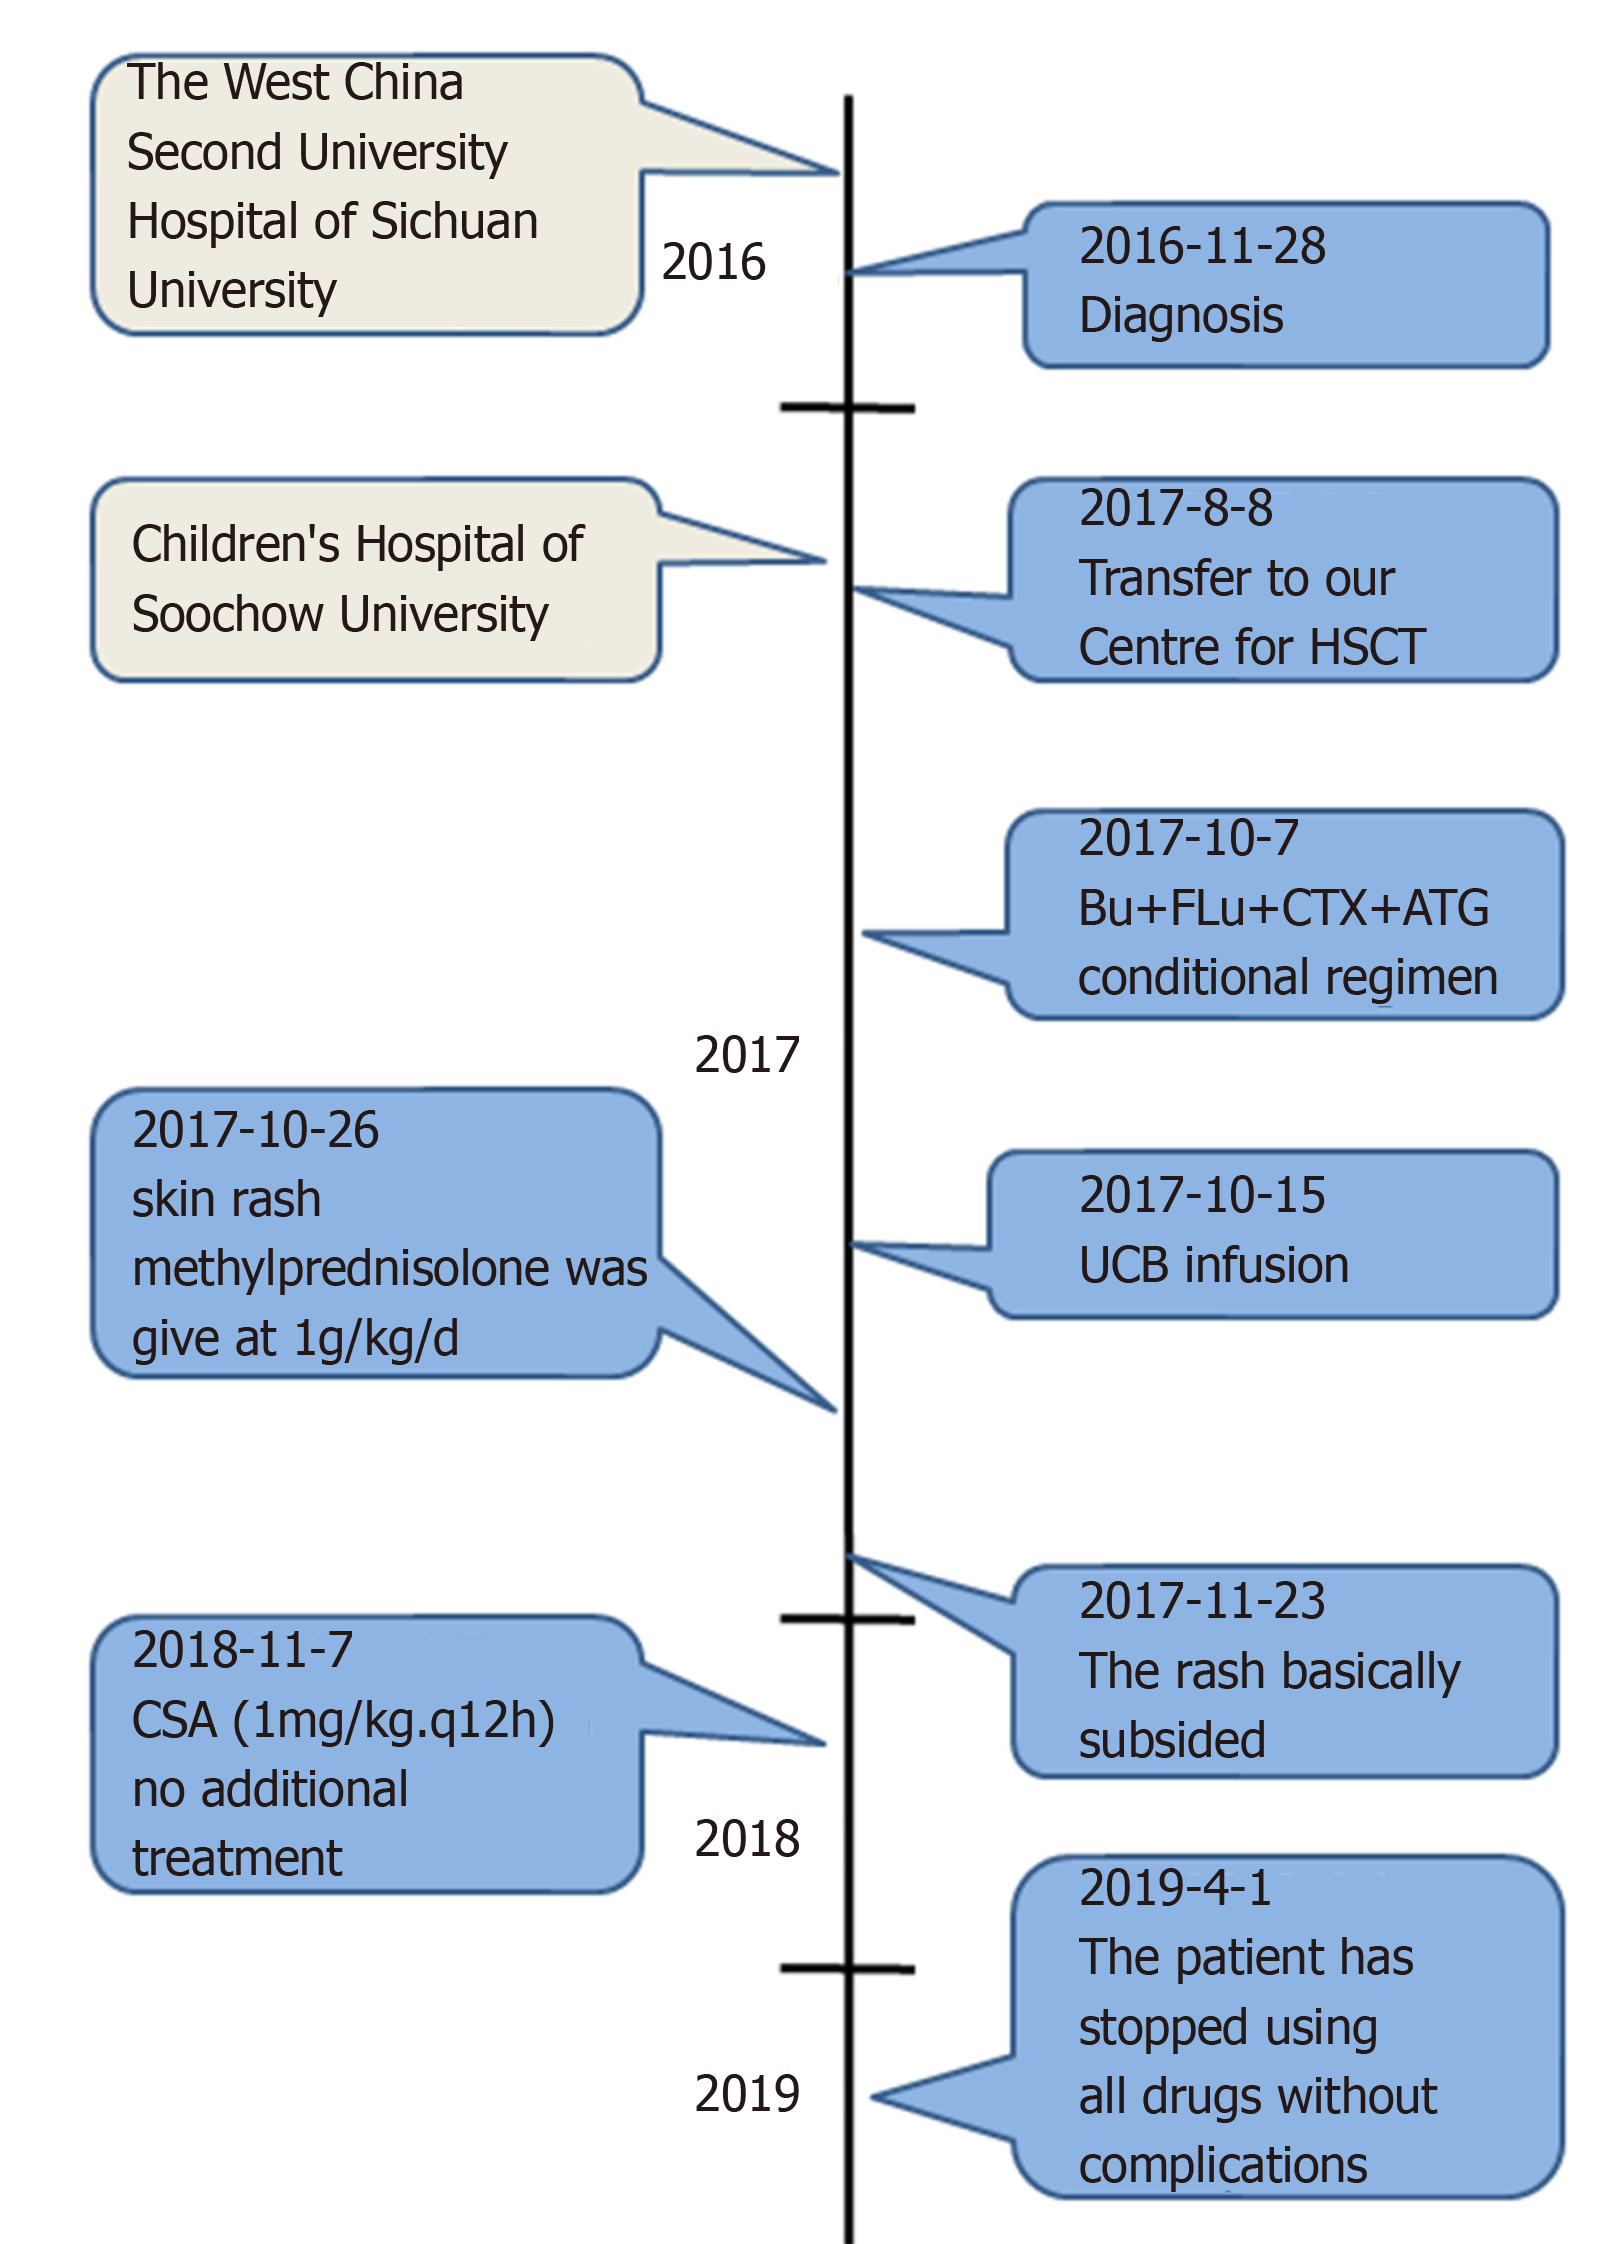
Figure 3 Timeline of interventions and outcomes.
- Citation: Li BH, Hu SY. Child with Wiskott–Aldrich syndrome underwent atypical immune reconstruction after umbilical cord blood transplantation: A case report. World J Clin Cases 2019; 7(21): 3622-3631
- URL: https://www.wjgnet.com/2307-8960/full/v7/i21/3622.htm
- DOI: https://dx.doi.org/10.12998/wjcc.v7.i21.3622


