Copyright
©The Author(s) 2019.
World J Clin Cases. Nov 6, 2019; 7(21): 3446-3462
Published online Nov 6, 2019. doi: 10.12998/wjcc.v7.i21.3446
Published online Nov 6, 2019. doi: 10.12998/wjcc.v7.i21.3446
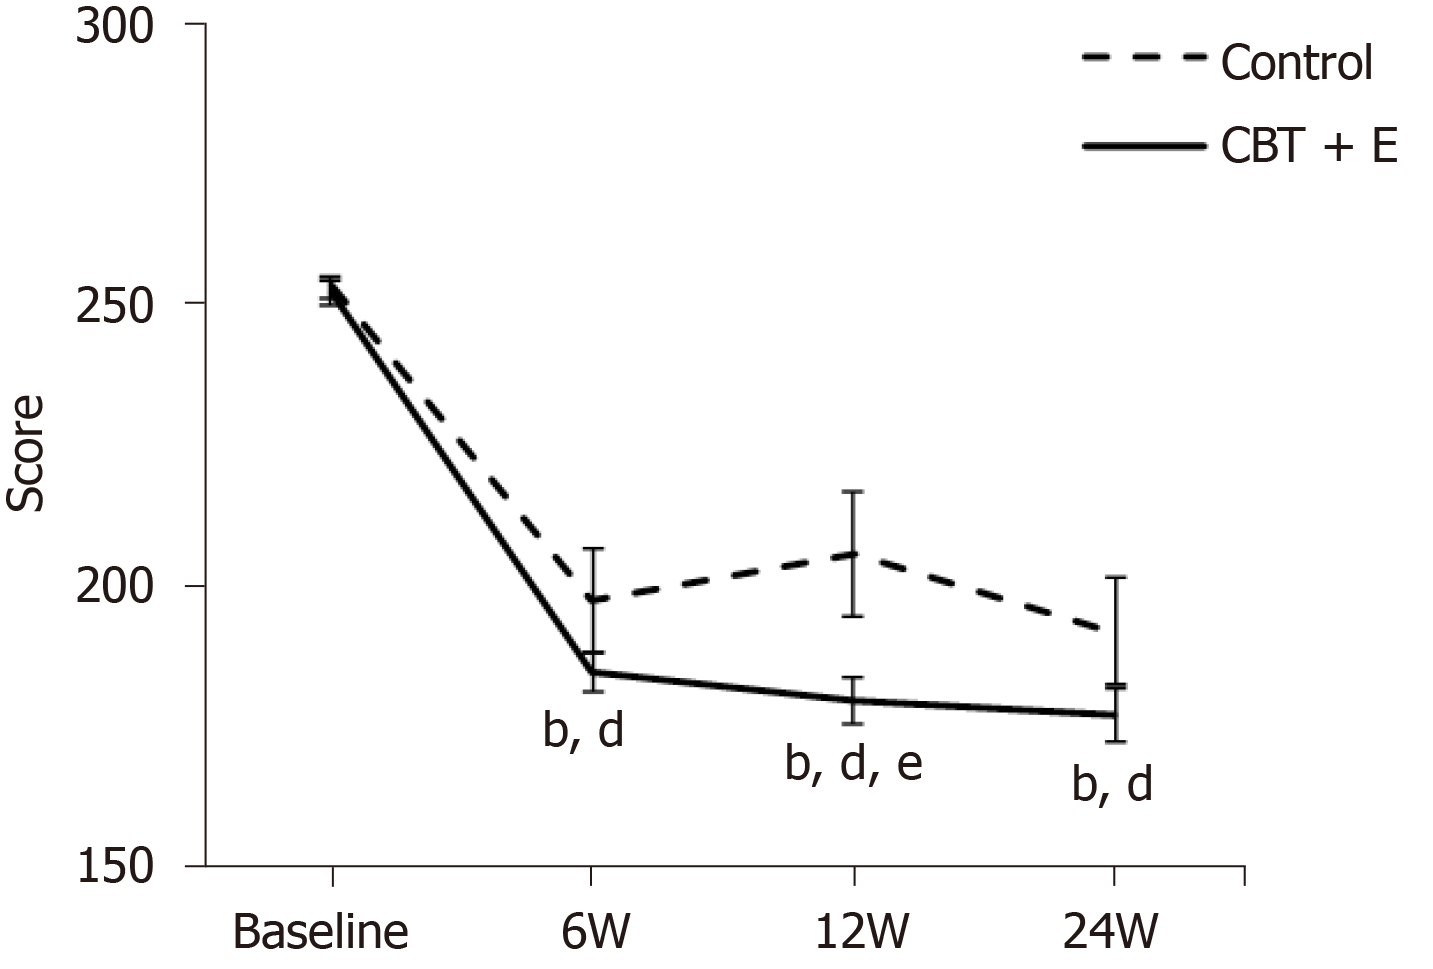
Figure 1 Irritable Bowel Syndrome Symptom Severity Scale score line chart.
aP < 0.05, bP < 0.01 indicates the comparison between the CBT+E group and the control group at each time point; cP < 0.05, dP < 0.01 indicates the intragroup comparison before and after the initiation of the intervention at each time point; eP < 0.05, fP < 0.01 indicates a 12-wk and 6-wk comparison or a 24-wk and 12-wk comparison.
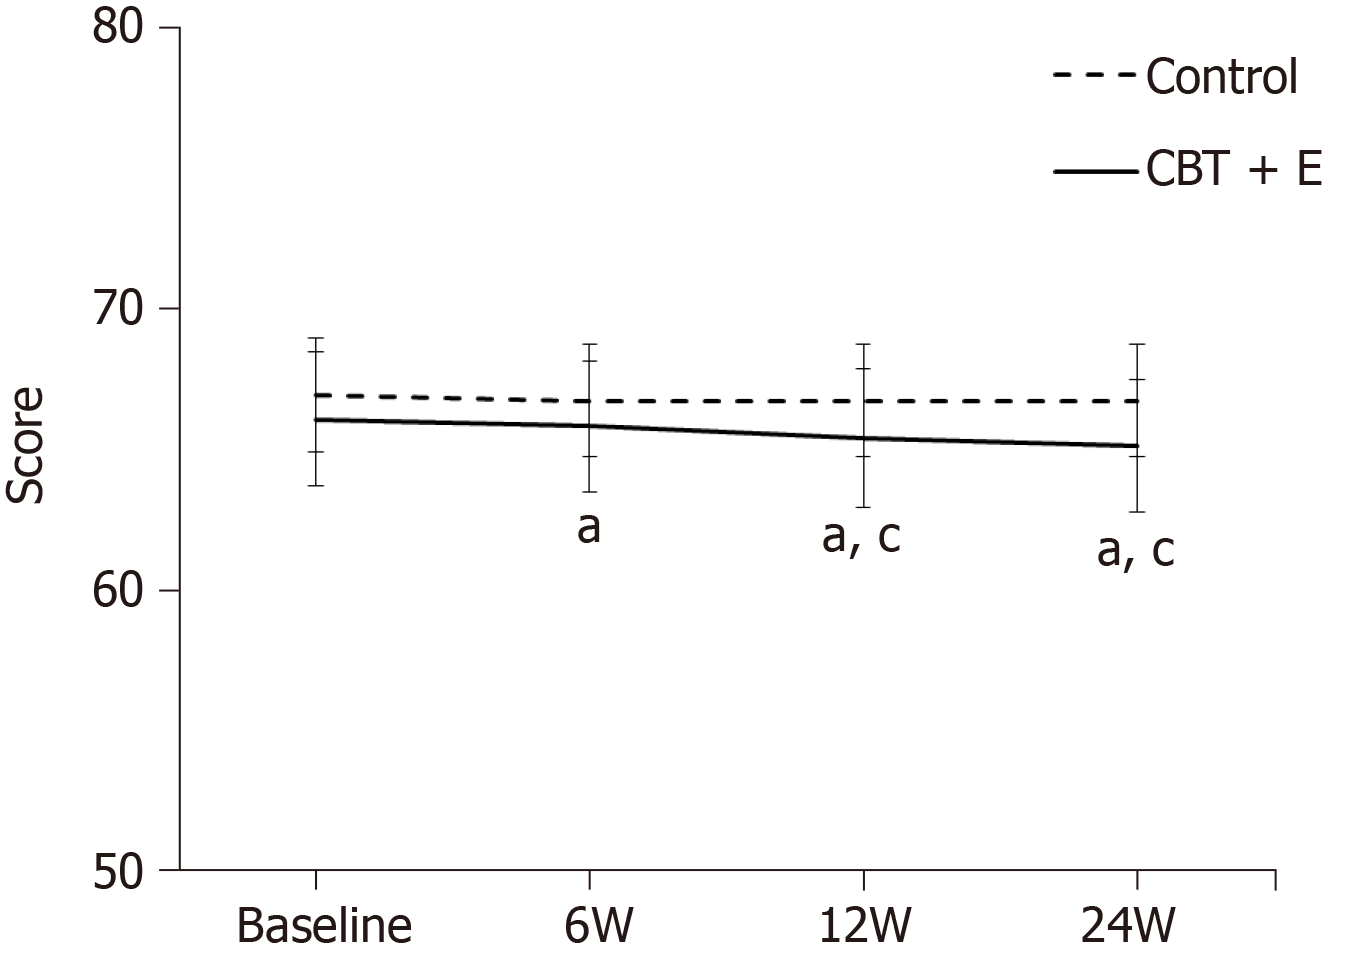
Figure 2 Automatic Thoughts Questionnaire Score line chart.
"a" is the comparison between the CBT+E group and the control group at each time point (aP < 0.05); "c" is the intragroup comparison before and after the intervention at each time point (cP < 0.05).
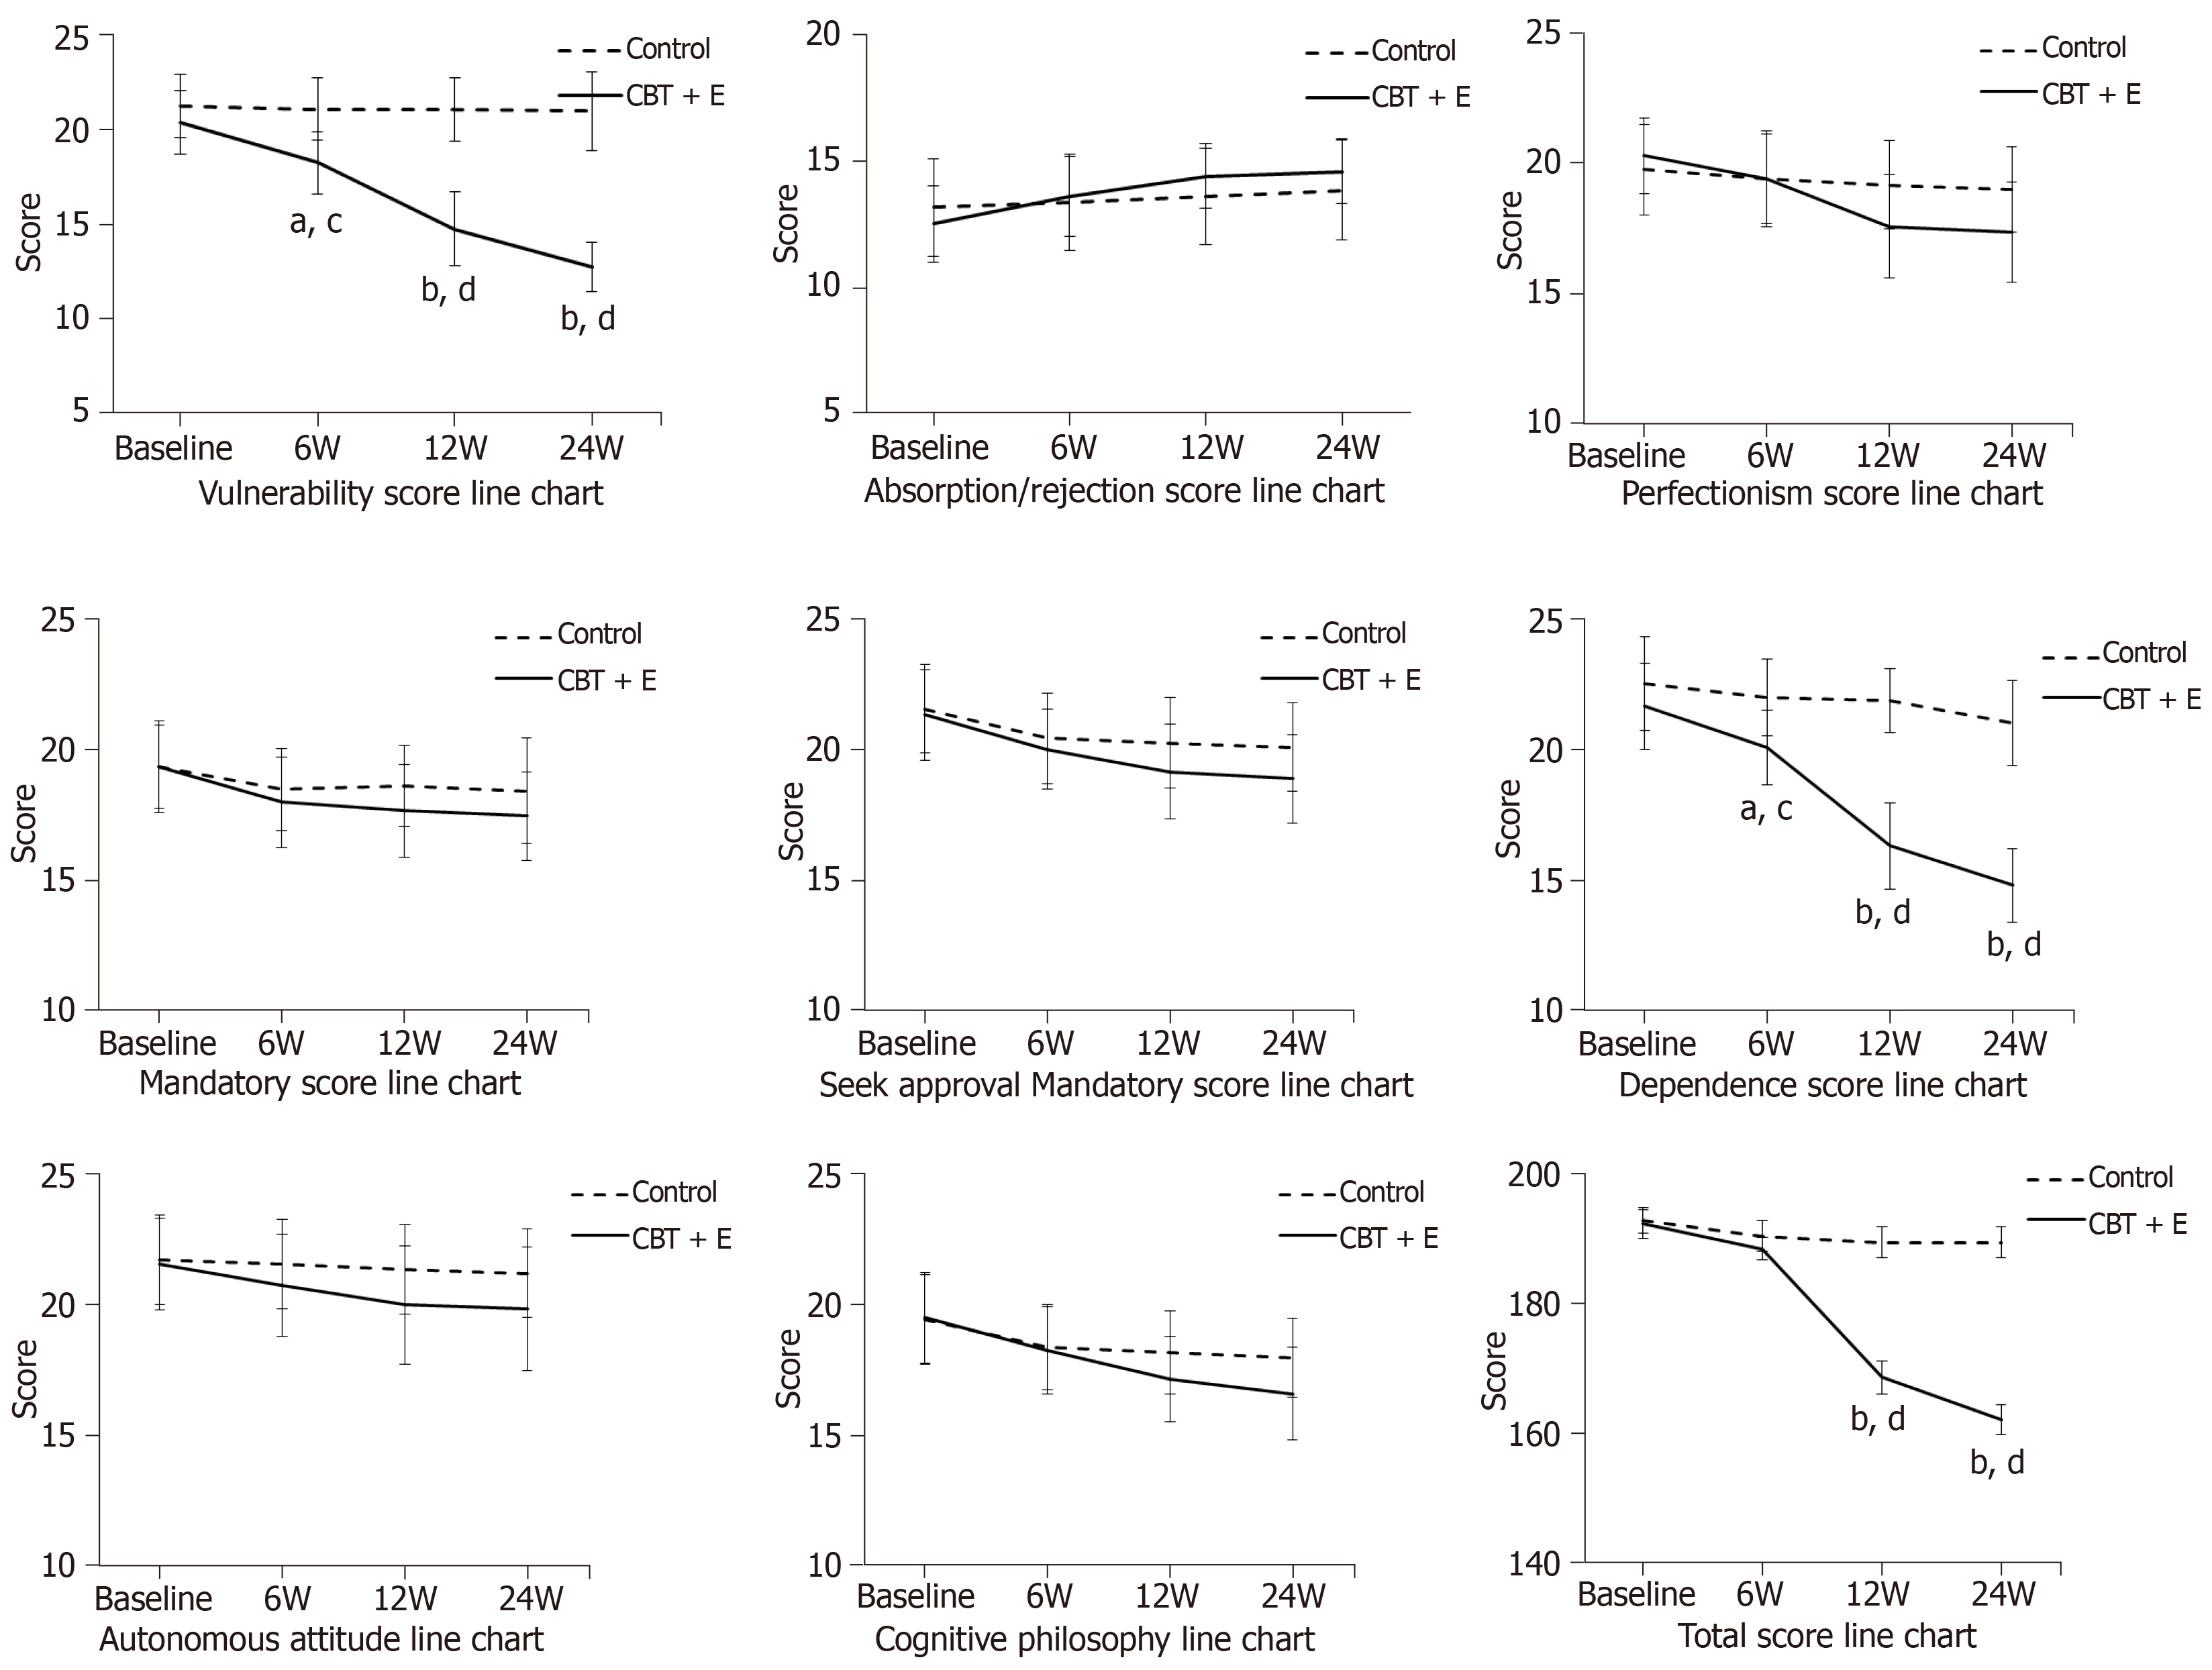
Figure 3 Score changes in the Automatic Thoughts Questionnaire and Dysfunctional Attitudes Scale dimensions.
"a or b" is the comparison between the CBT+E group and the control group at each time point (aP < 0.05, bP < 0.01); "c or d" is the intragroup comparison before and after the intervention at each time point (cP < 0.05, dP < 0.01).
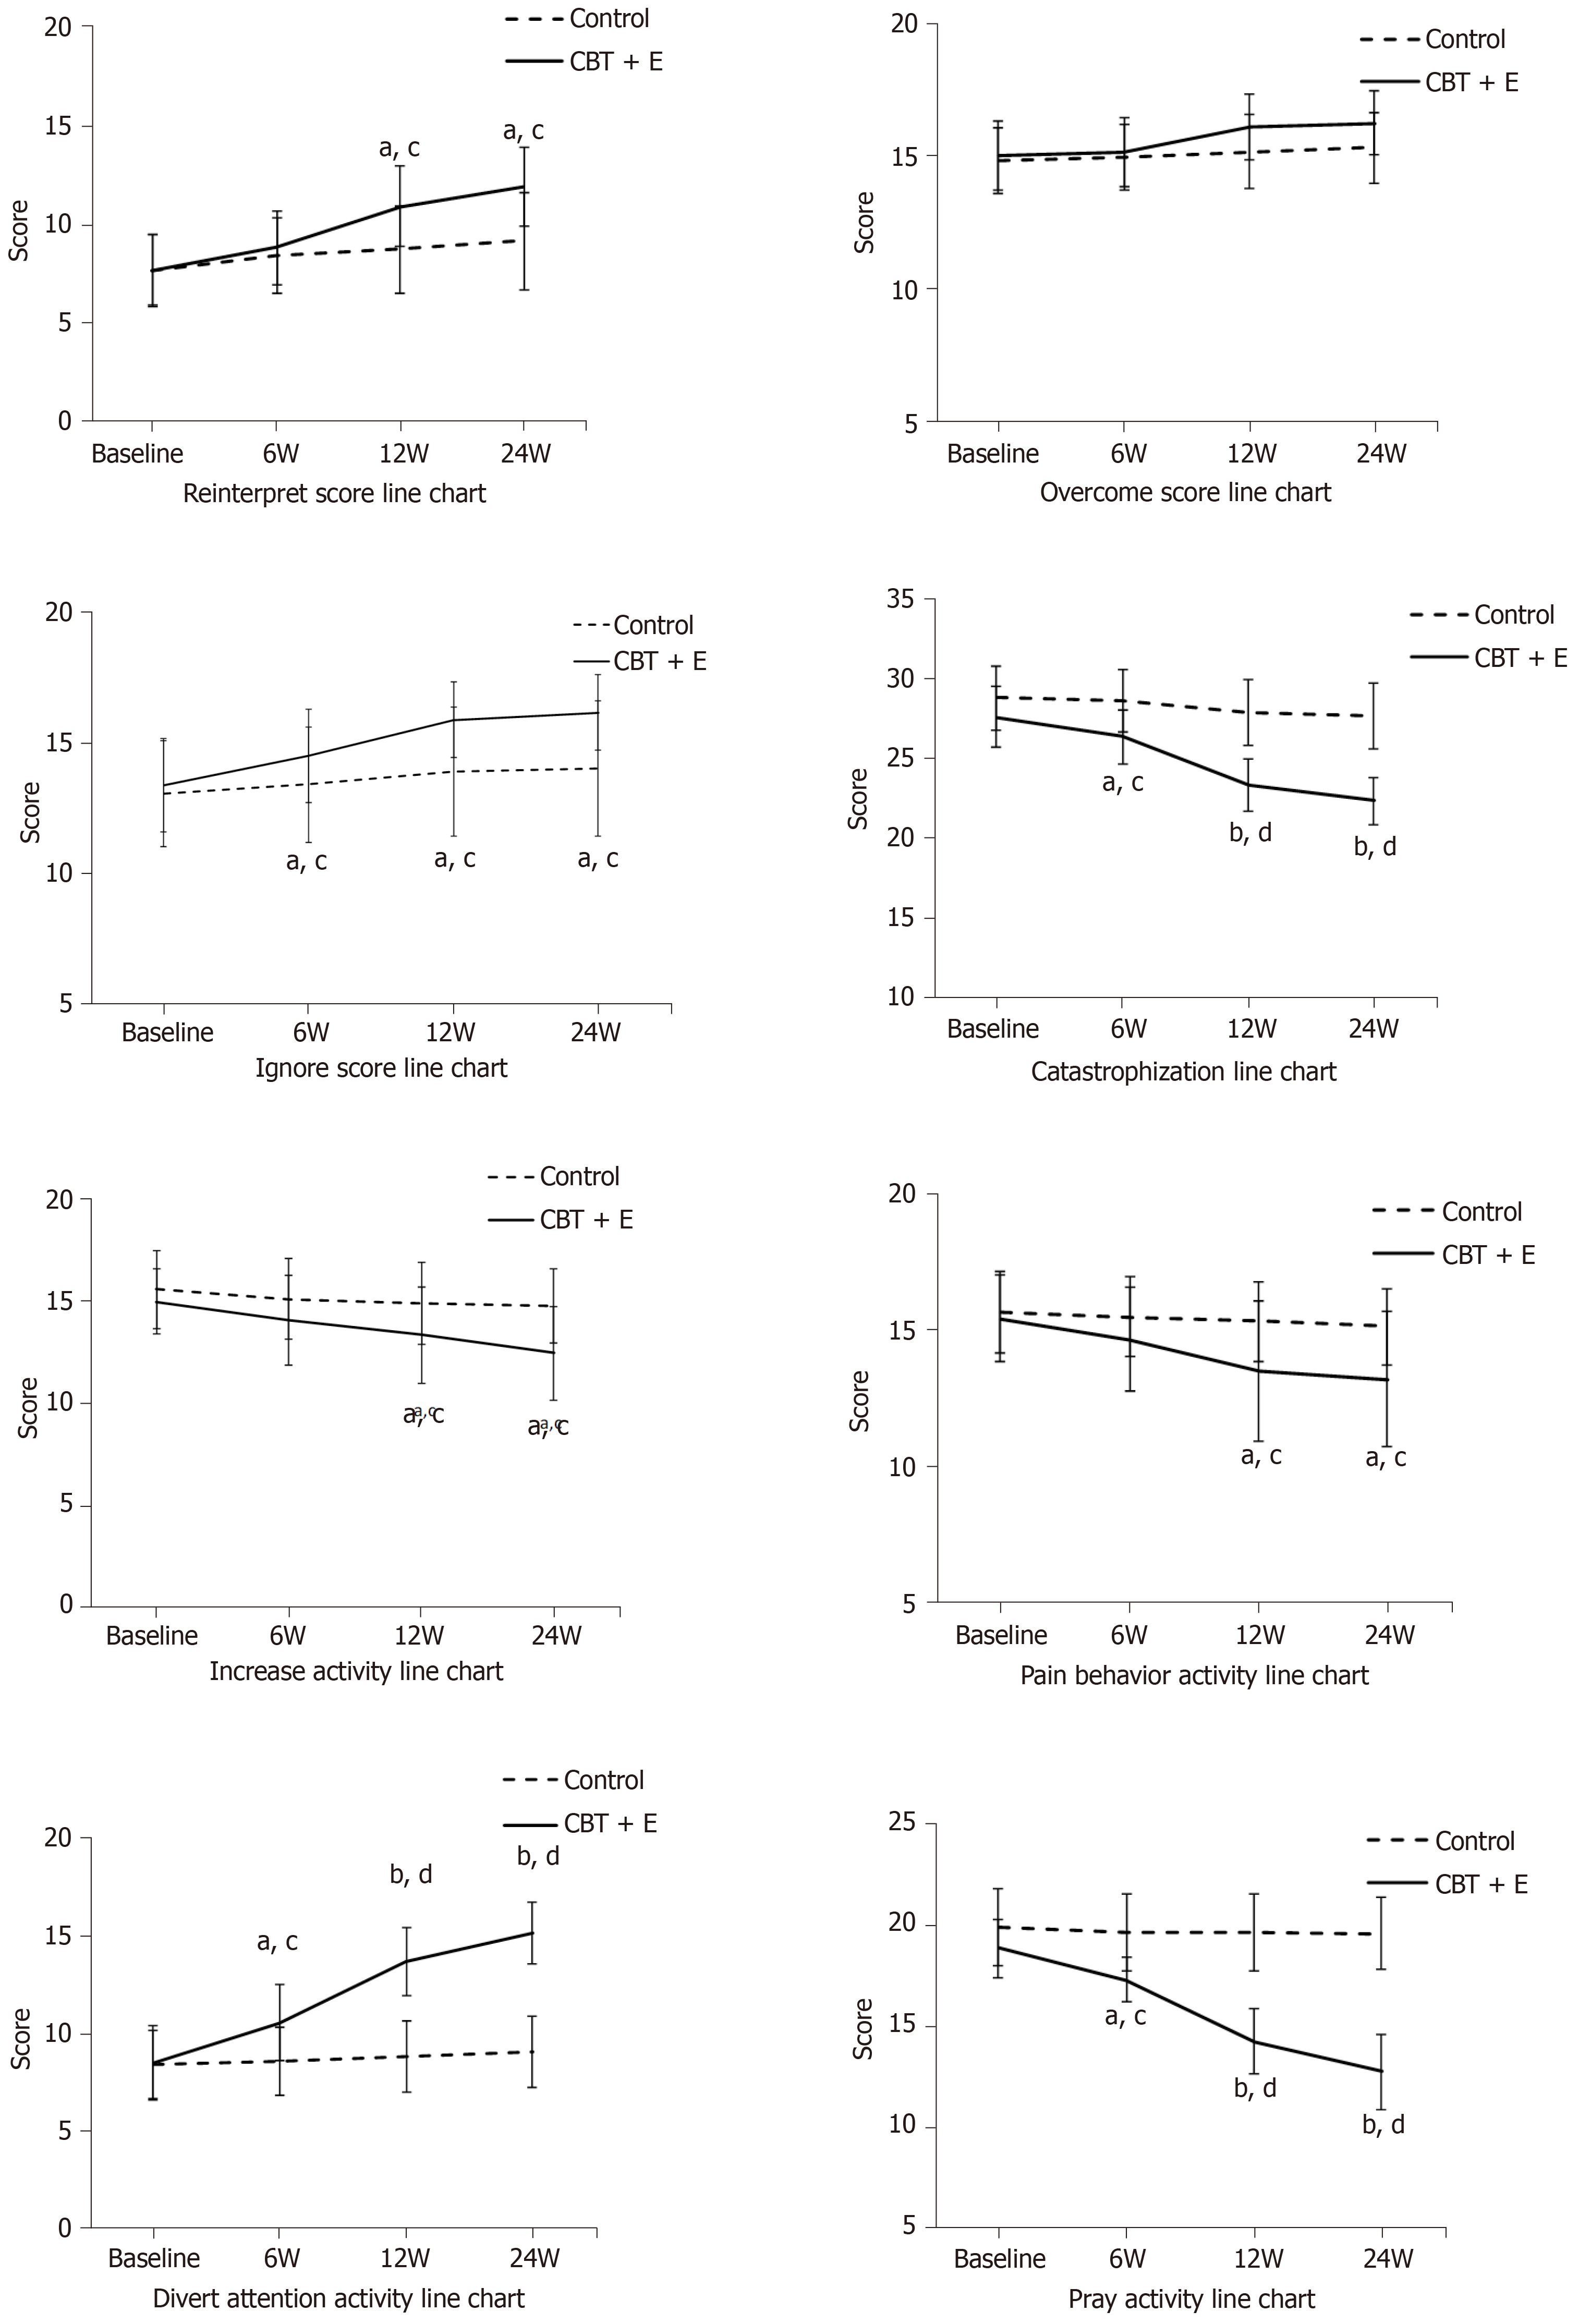
Figure 4 Pain Coping Style Questionnaire scores in each experimental group before and after intervention.
"a or b" is the comparison between the CBT+E group and the control group at each time point (aP < 0.05, bP < 0.01); "c or d" is the intragroup comparison before and after the intervention at each time point (cP < 0.05, dP < 0.01).
- Citation: Zhao SR, Ni XM, Zhang XA, Tian H. Effect of cognitive behavior therapy combined with exercise intervention on the cognitive bias and coping styles of diarrhea-predominant irritable bowel syndrome patients. World J Clin Cases 2019; 7(21): 3446-3462
- URL: https://www.wjgnet.com/2307-8960/full/v7/i21/3446.htm
- DOI: https://dx.doi.org/10.12998/wjcc.v7.i21.3446


