Copyright
©The Author(s) 2019.
World J Clin Cases. Sep 6, 2019; 7(17): 2427-2437
Published online Sep 6, 2019. doi: 10.12998/wjcc.v7.i17.2427
Published online Sep 6, 2019. doi: 10.12998/wjcc.v7.i17.2427
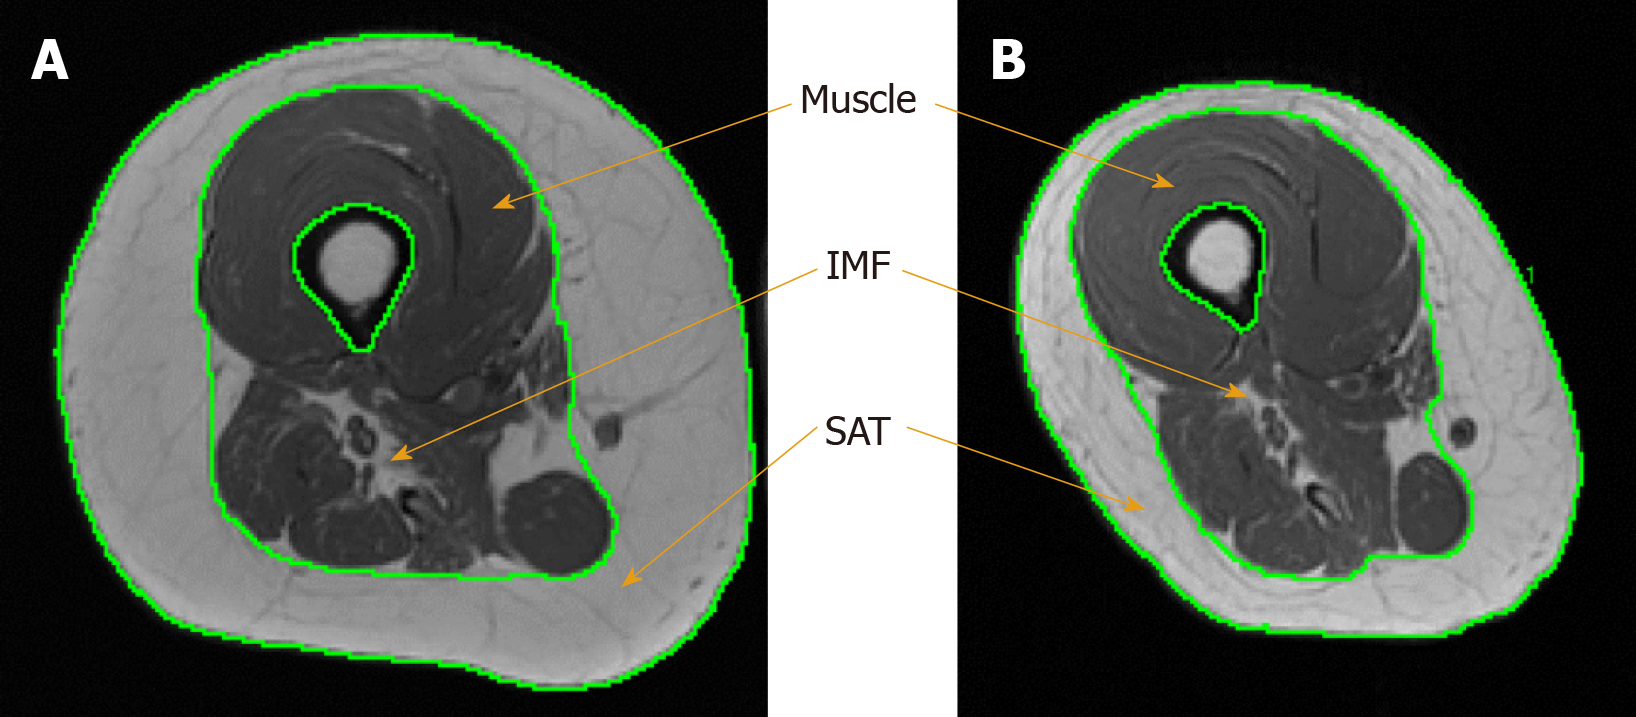
Figure 1 Robust changes in subcutaneous adipose tissue, intramuscular fat and muscle size between baseline and post-intervention measurements.
A: Baseline magnetic resonance imaging (MRI) of the right thigh showing large subcutaneous adipose tissue (SAT) and intramuscular fat (IMF) depots prior to dietary intervention; B: Post-intervention matched MRI of right thigh after 16 wk of intervention showing reduced SAT and IMF depots and increased muscle cross-sectional area.
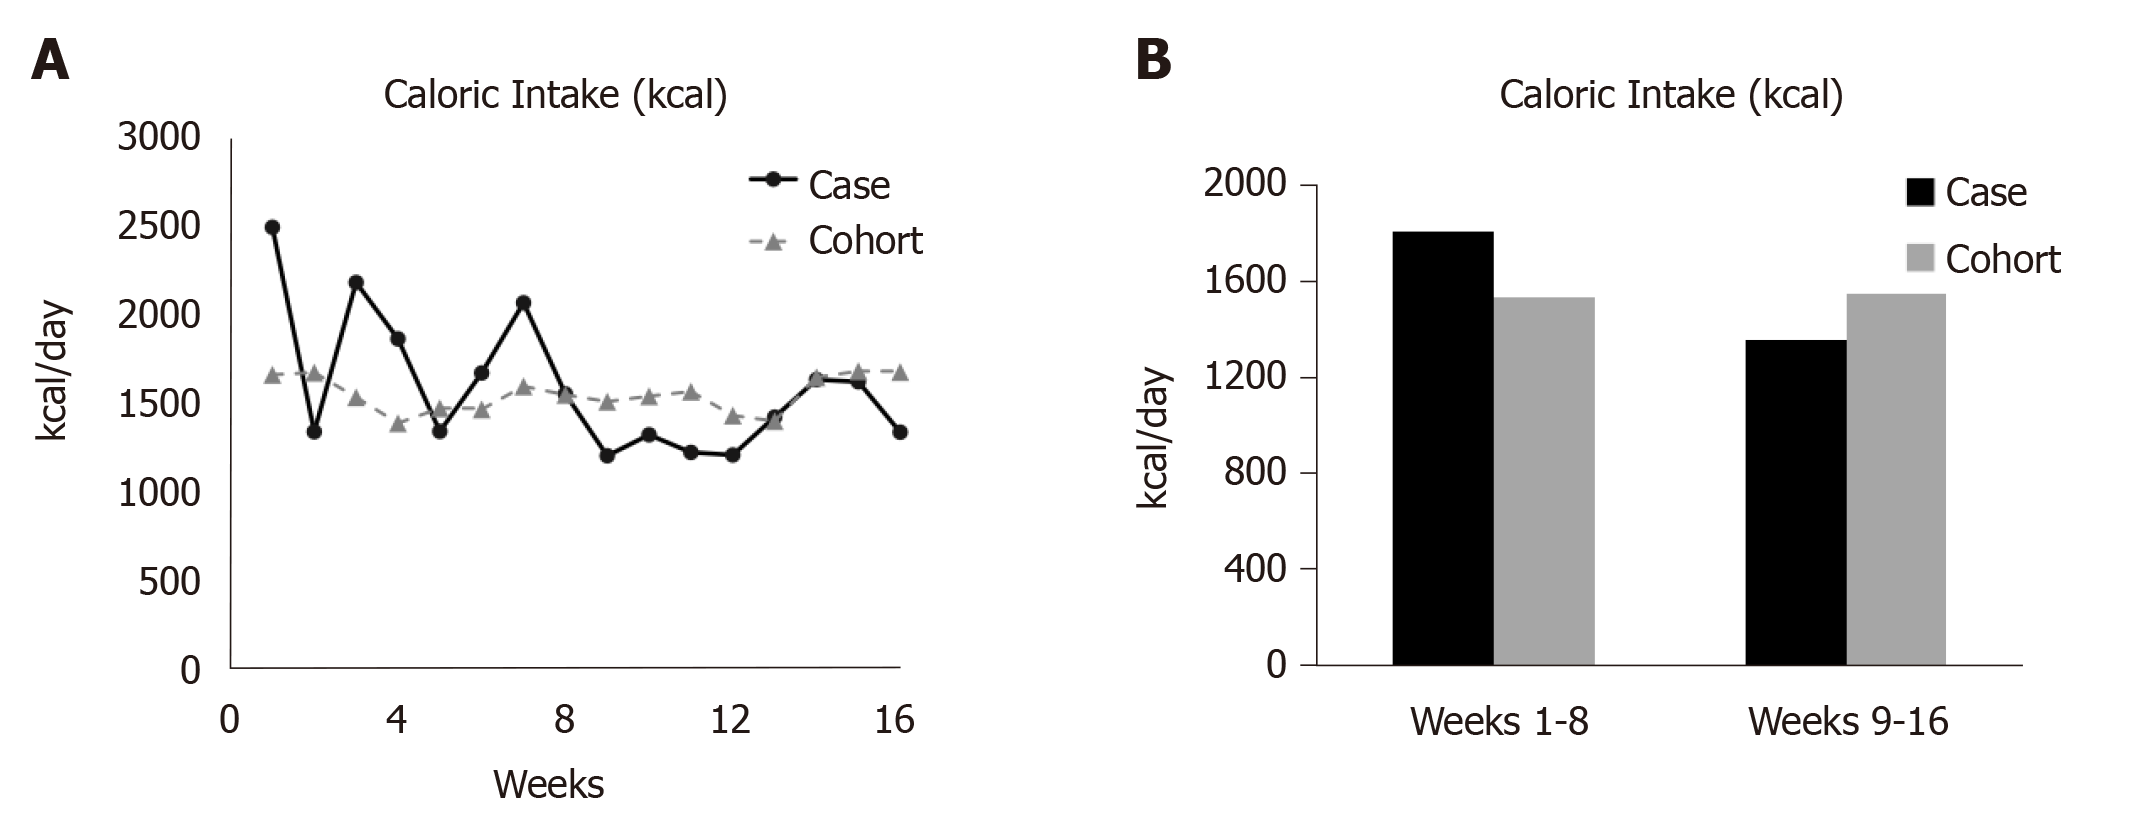
Figure 2 The trend in caloric consumption (kcal) of the participant and cohort during the course of the study (A) and the average caloric consumption of the case and cohort during the first and second phases of intervention (B).
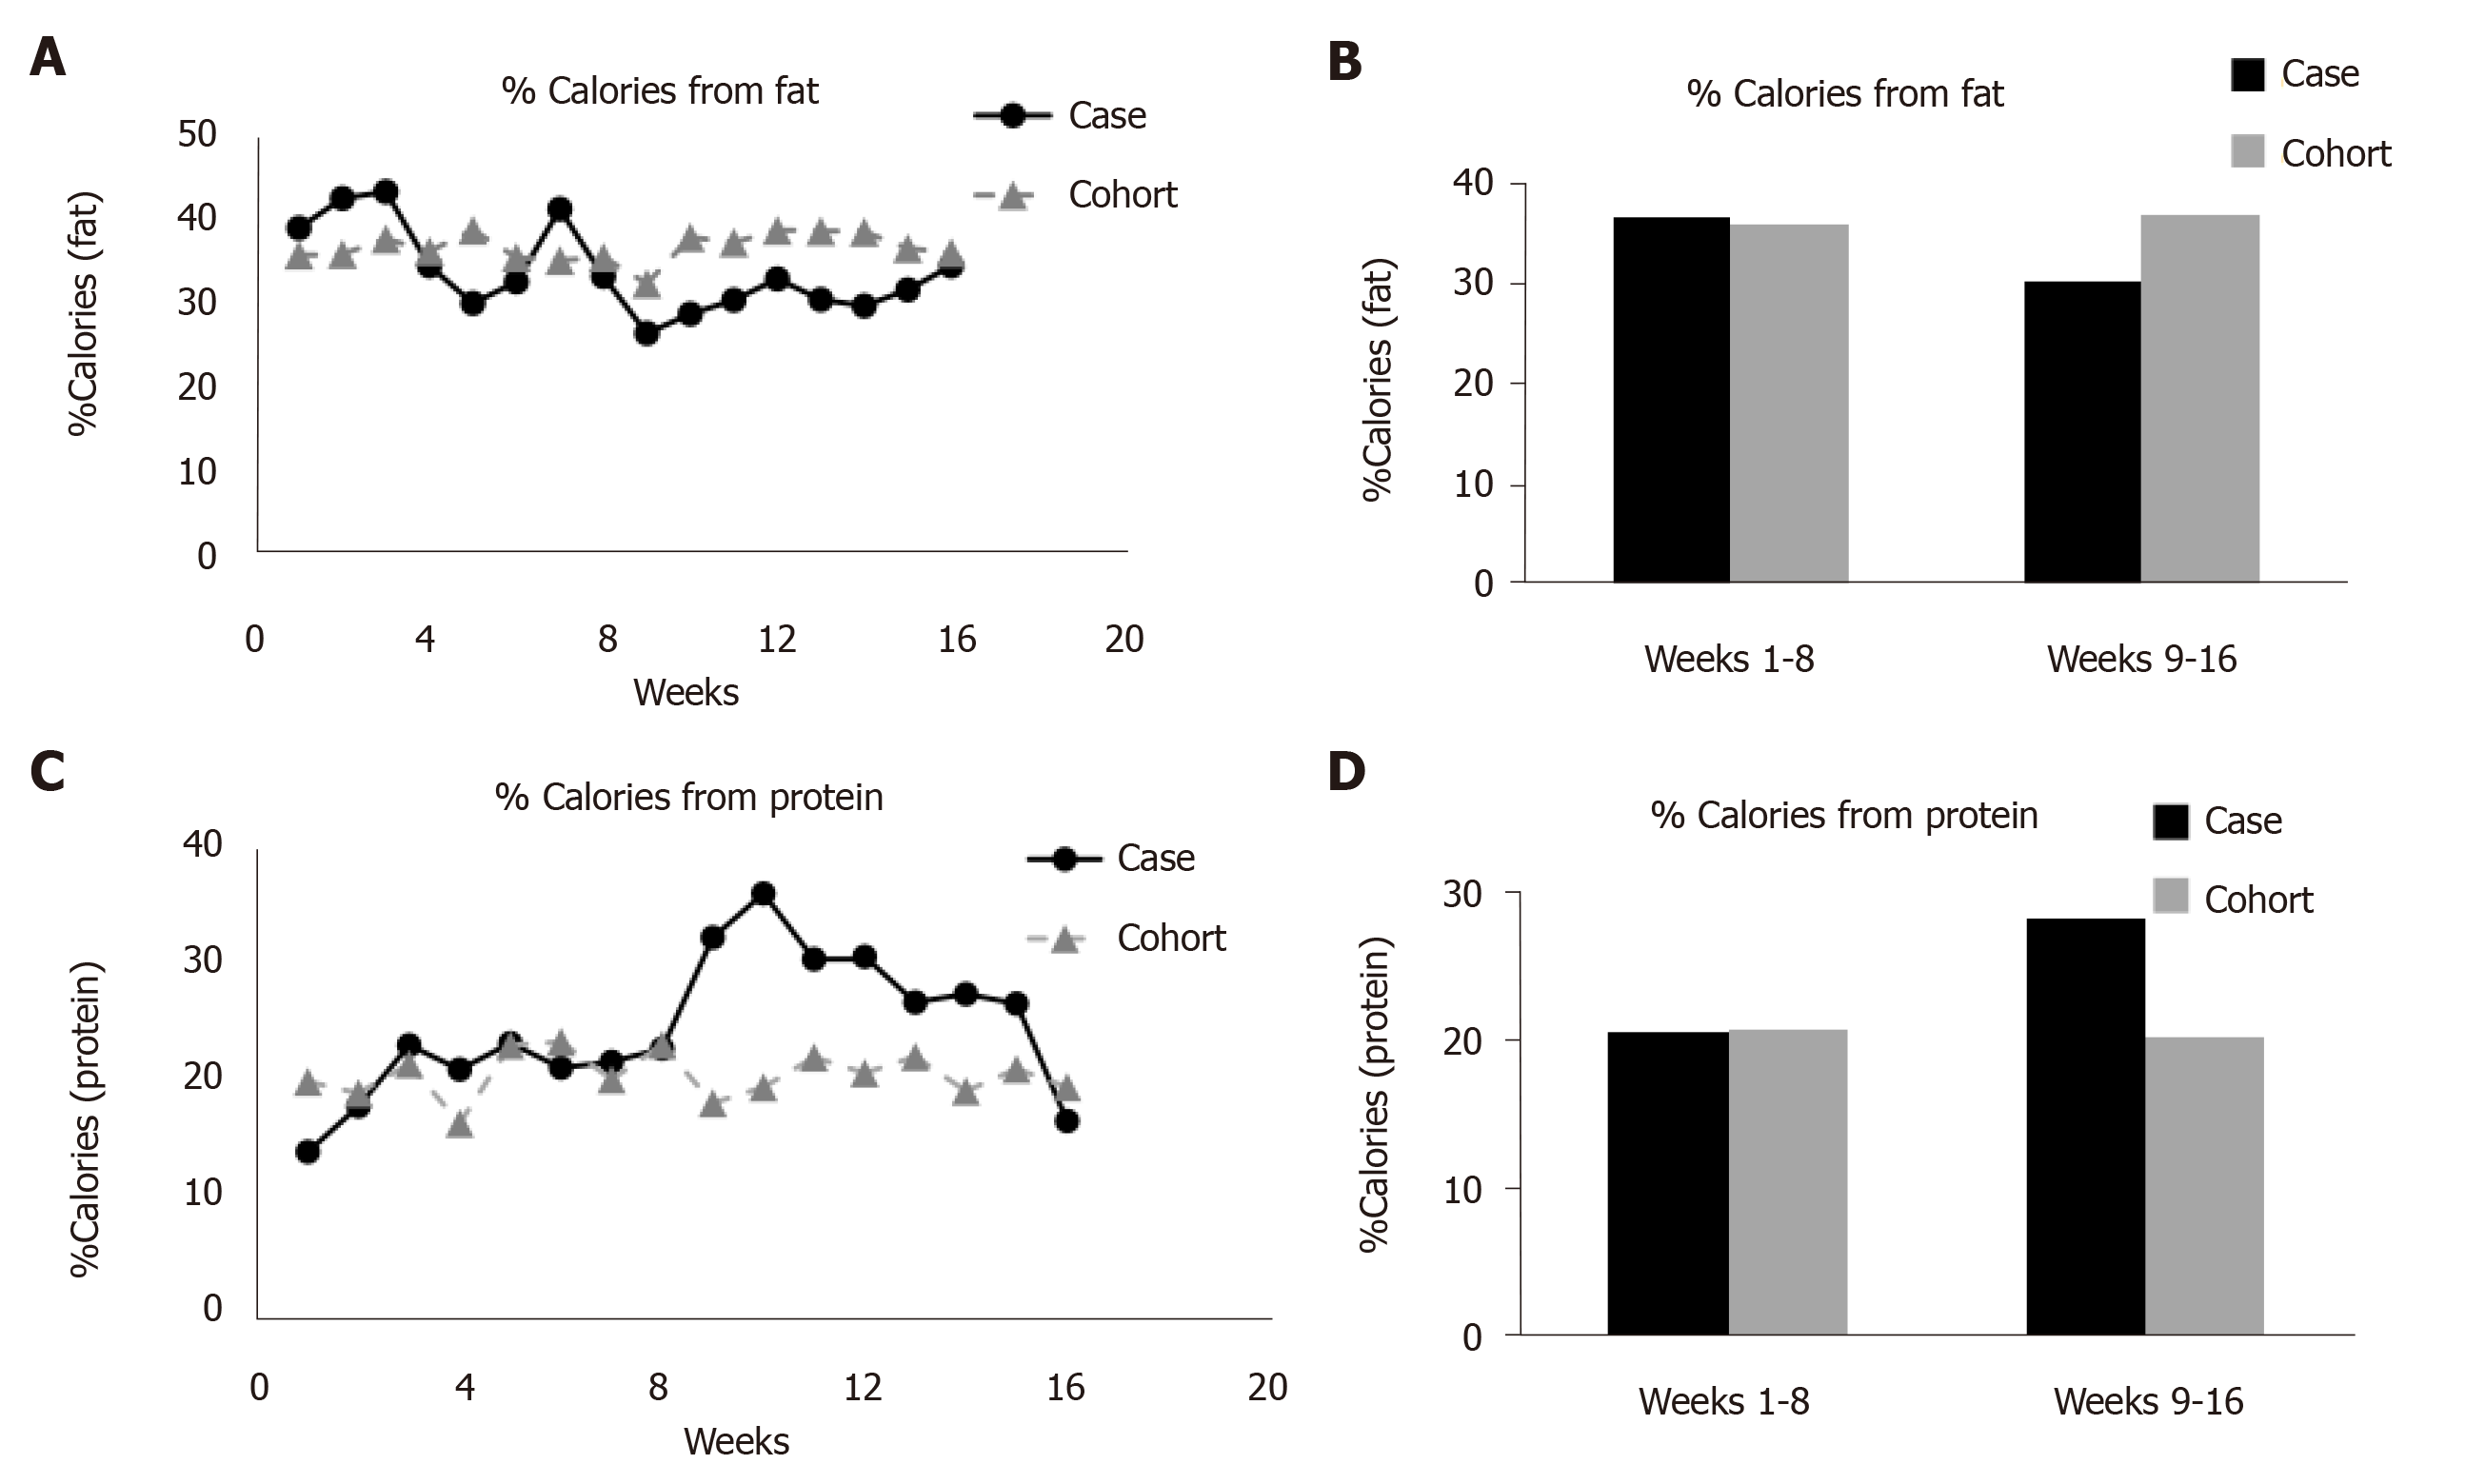
Figure 3 Percentage calories from fat.
A: Percentage fat intake of the participant and cohort during the course of the study; B: The average percentage fat consumption during the first and second phases of intervention; C: Percentage protein consumption of the participant and cohort during the course of the study; D: The average percentage protein intake during the first and second phases of intervention.
- Citation: Gorgey AS, Lester RM, Ghatas MP, Sistrun SN, Lavis T. Dietary manipulation and testosterone replacement therapy may explain changes in body composition after spinal cord injury: A retrospective case report. World J Clin Cases 2019; 7(17): 2427-2437
- URL: https://www.wjgnet.com/2307-8960/full/v7/i17/2427.htm
- DOI: https://dx.doi.org/10.12998/wjcc.v7.i17.2427


