Copyright
©The Author(s) 2019.
World J Clin Cases. Aug 6, 2019; 7(15): 2065-2074
Published online Aug 6, 2019. doi: 10.12998/wjcc.v7.i15.2065
Published online Aug 6, 2019. doi: 10.12998/wjcc.v7.i15.2065
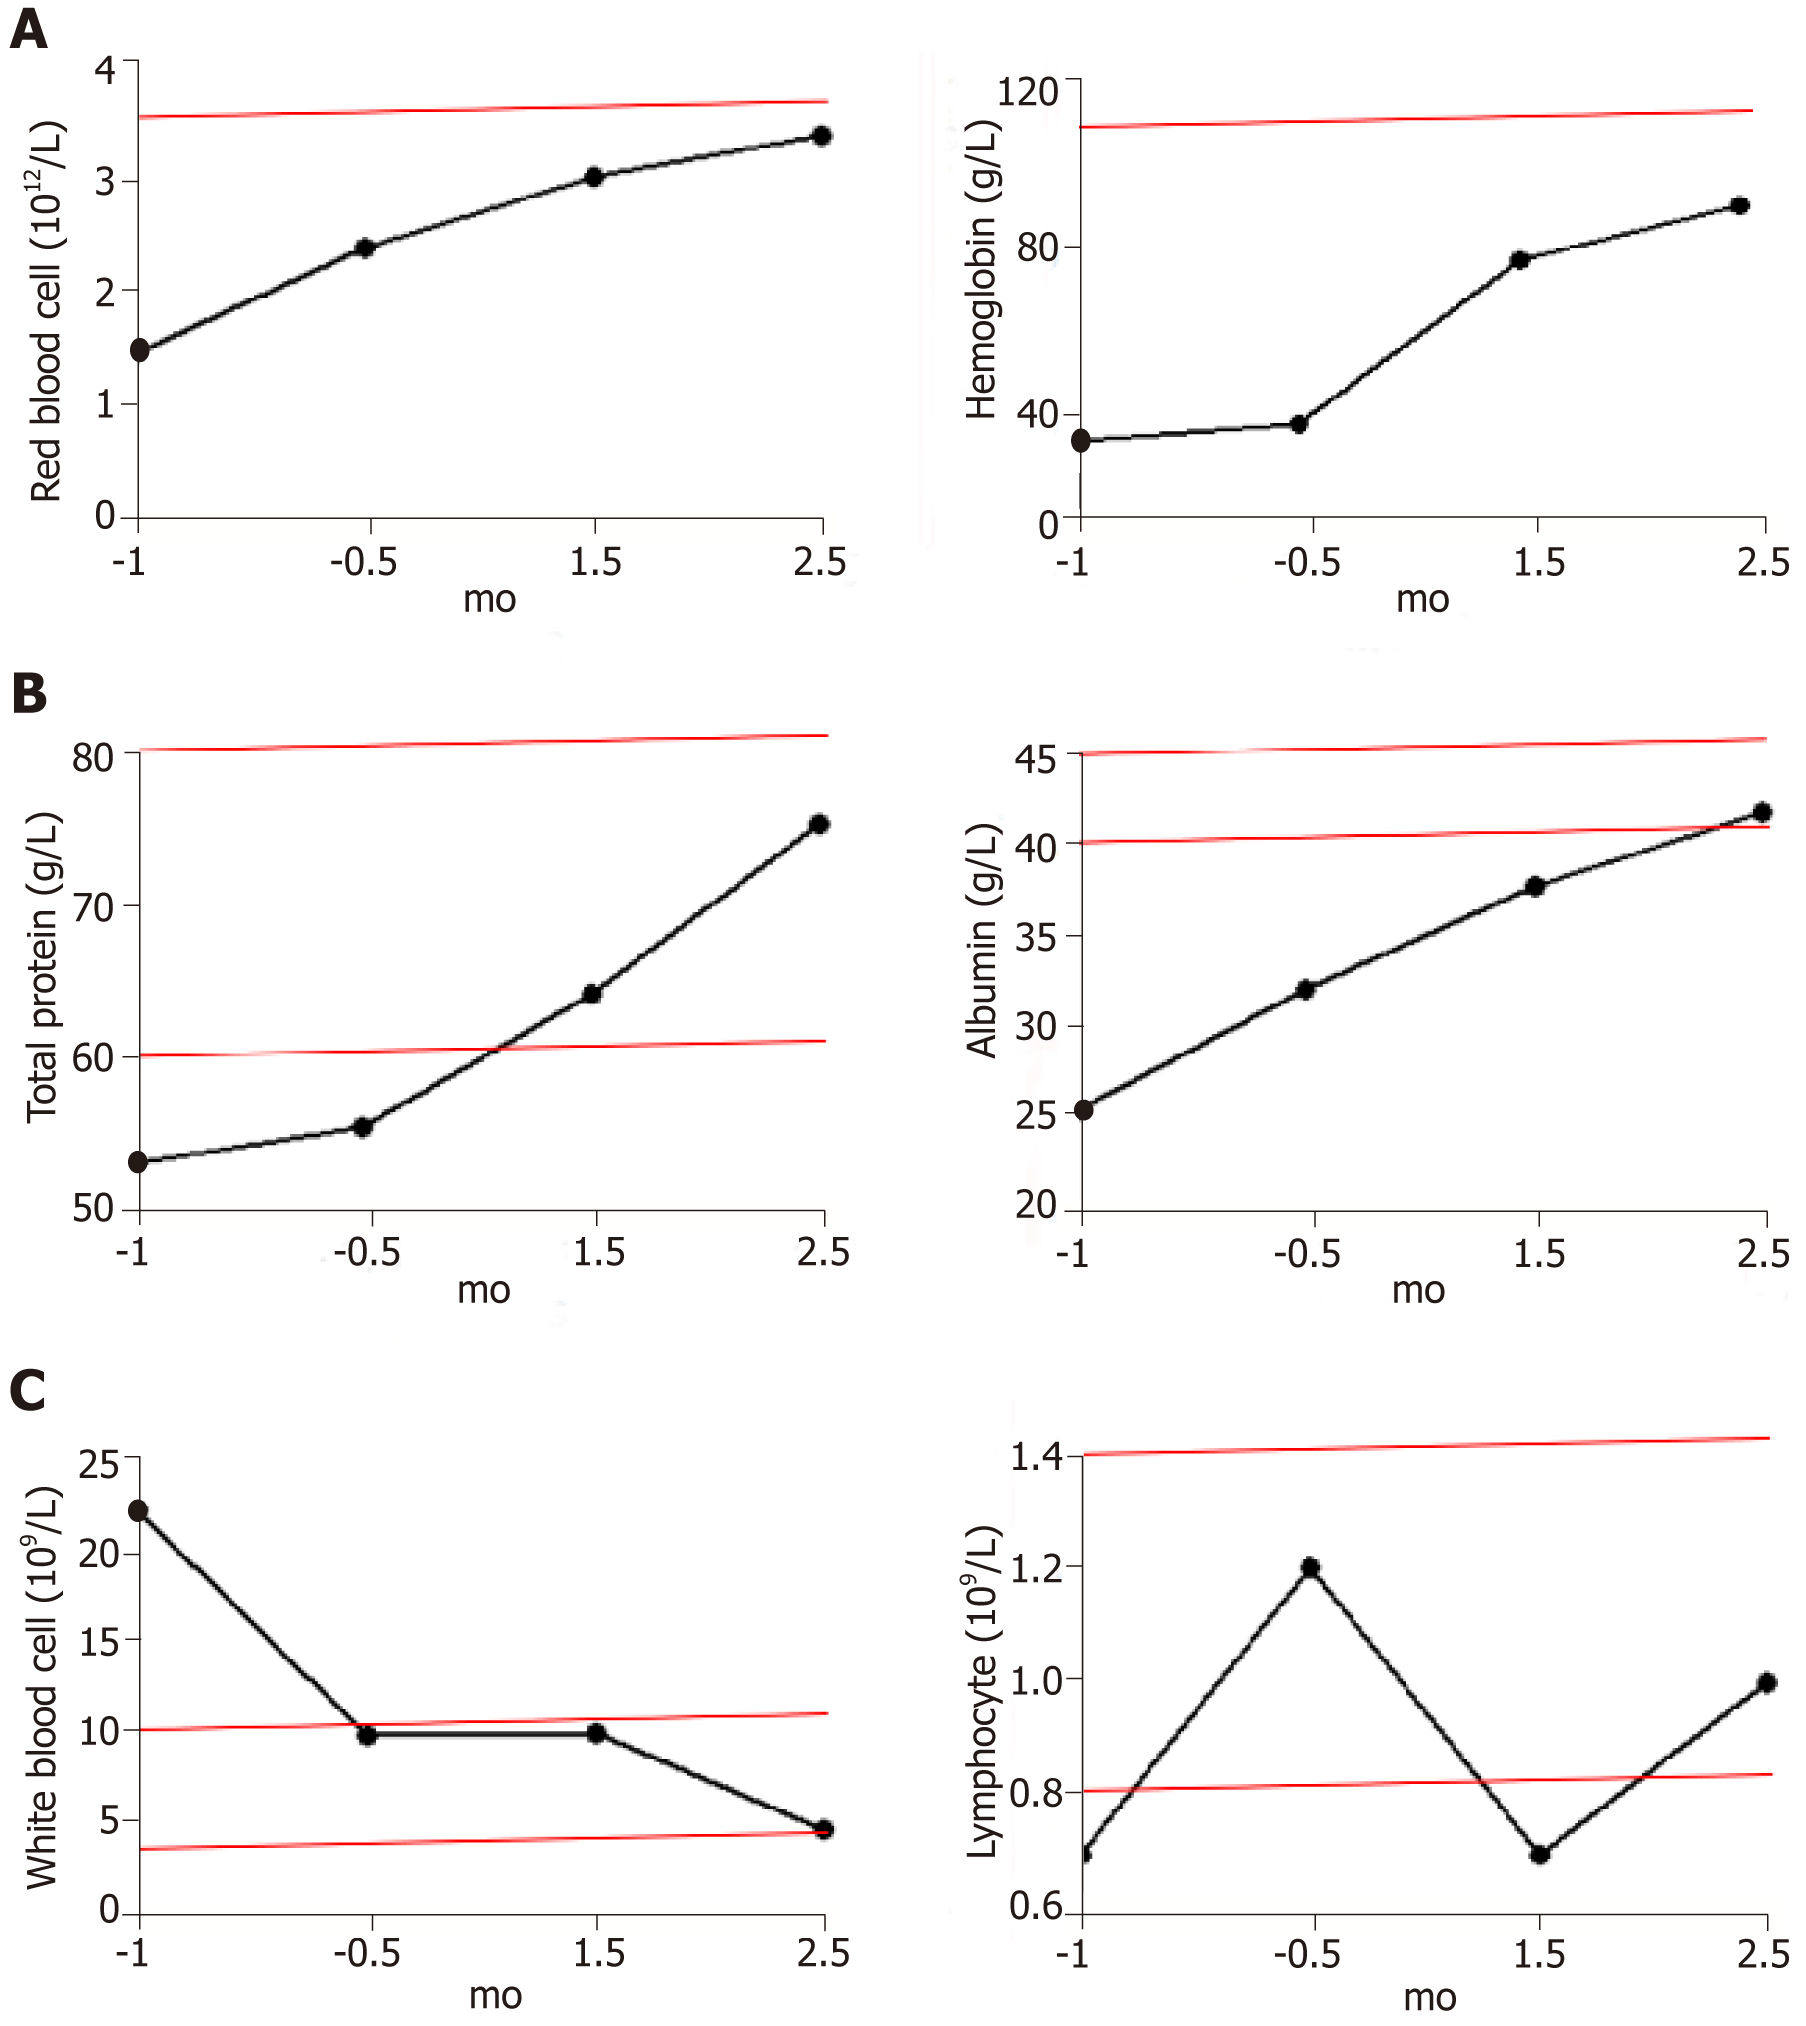
Figure 1 Blood parameters of patients before and after hydrogen treatment.
A: Red blood cell counts and hemoglobin levels; the red line in the figures represents the lower limit of the reference range; B: Total protein and albumin concentrations; the red lines in the figures represent the reference range; C: White blood cell and lymphocyte counts; the red lines in the figures represent the reference range.
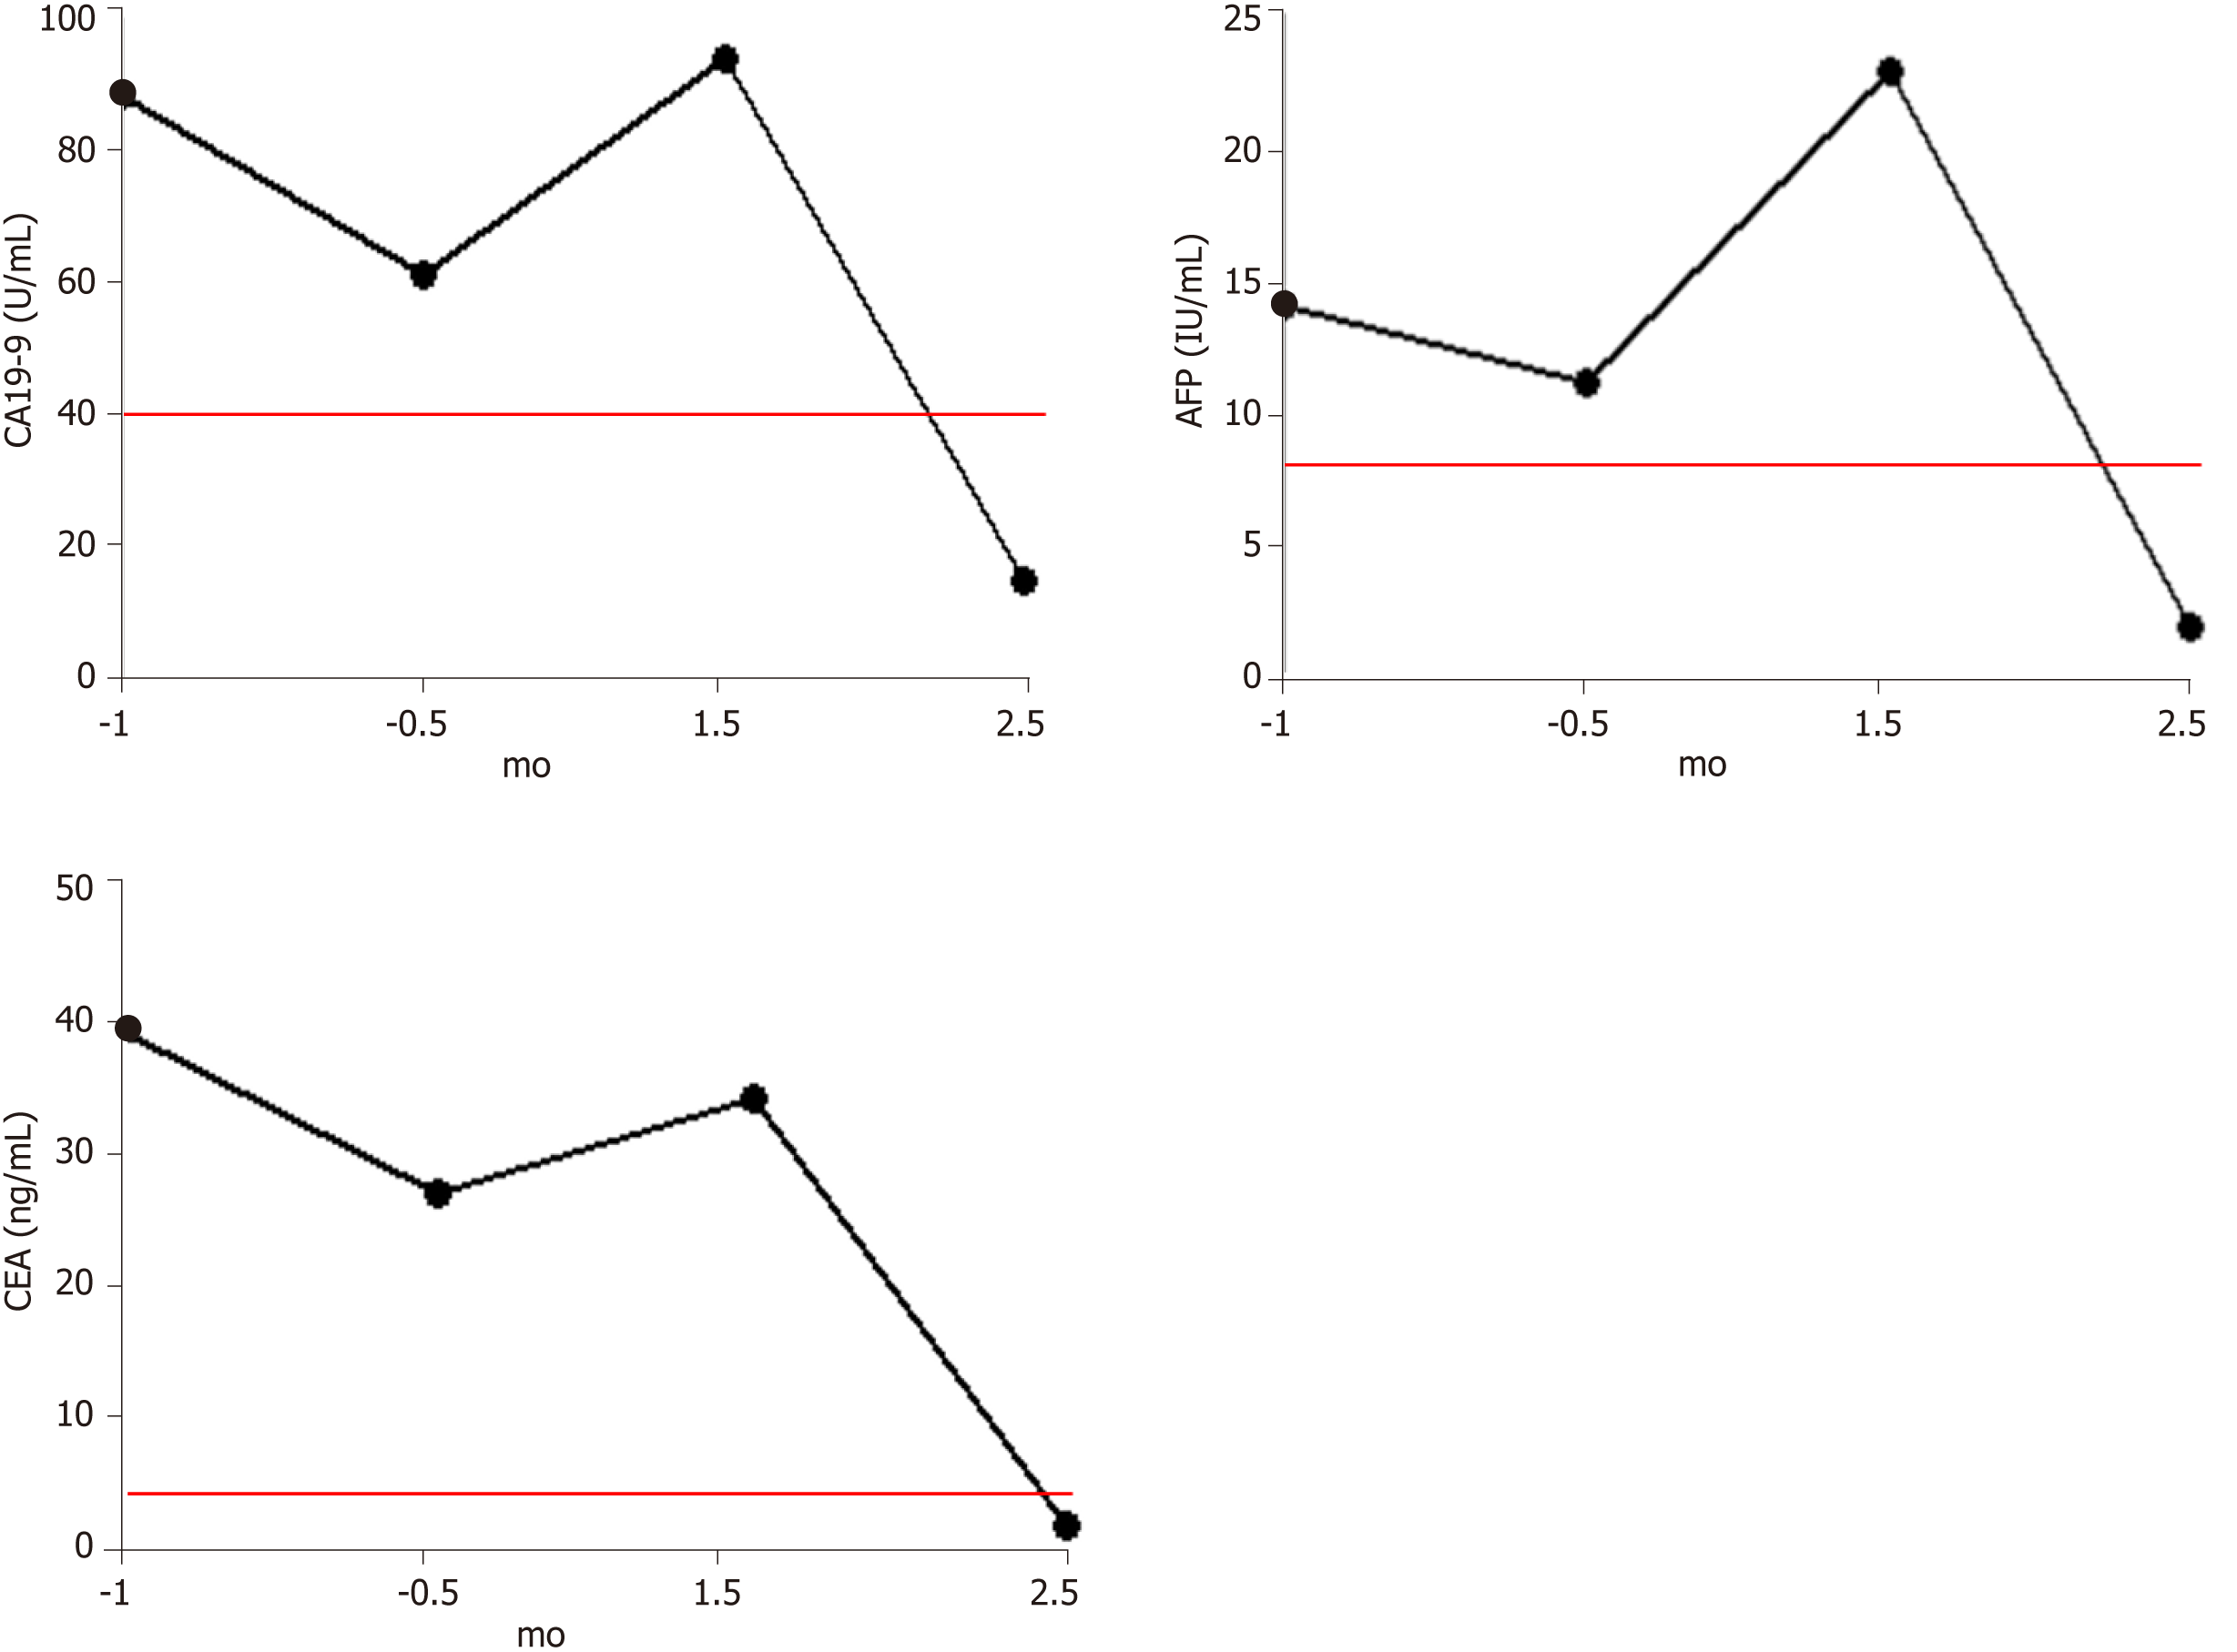
Figure 2 Changes in tumor markers before and after hydrogen treatment.
The red lines in the figures represent the upper limit of the reference ranges.
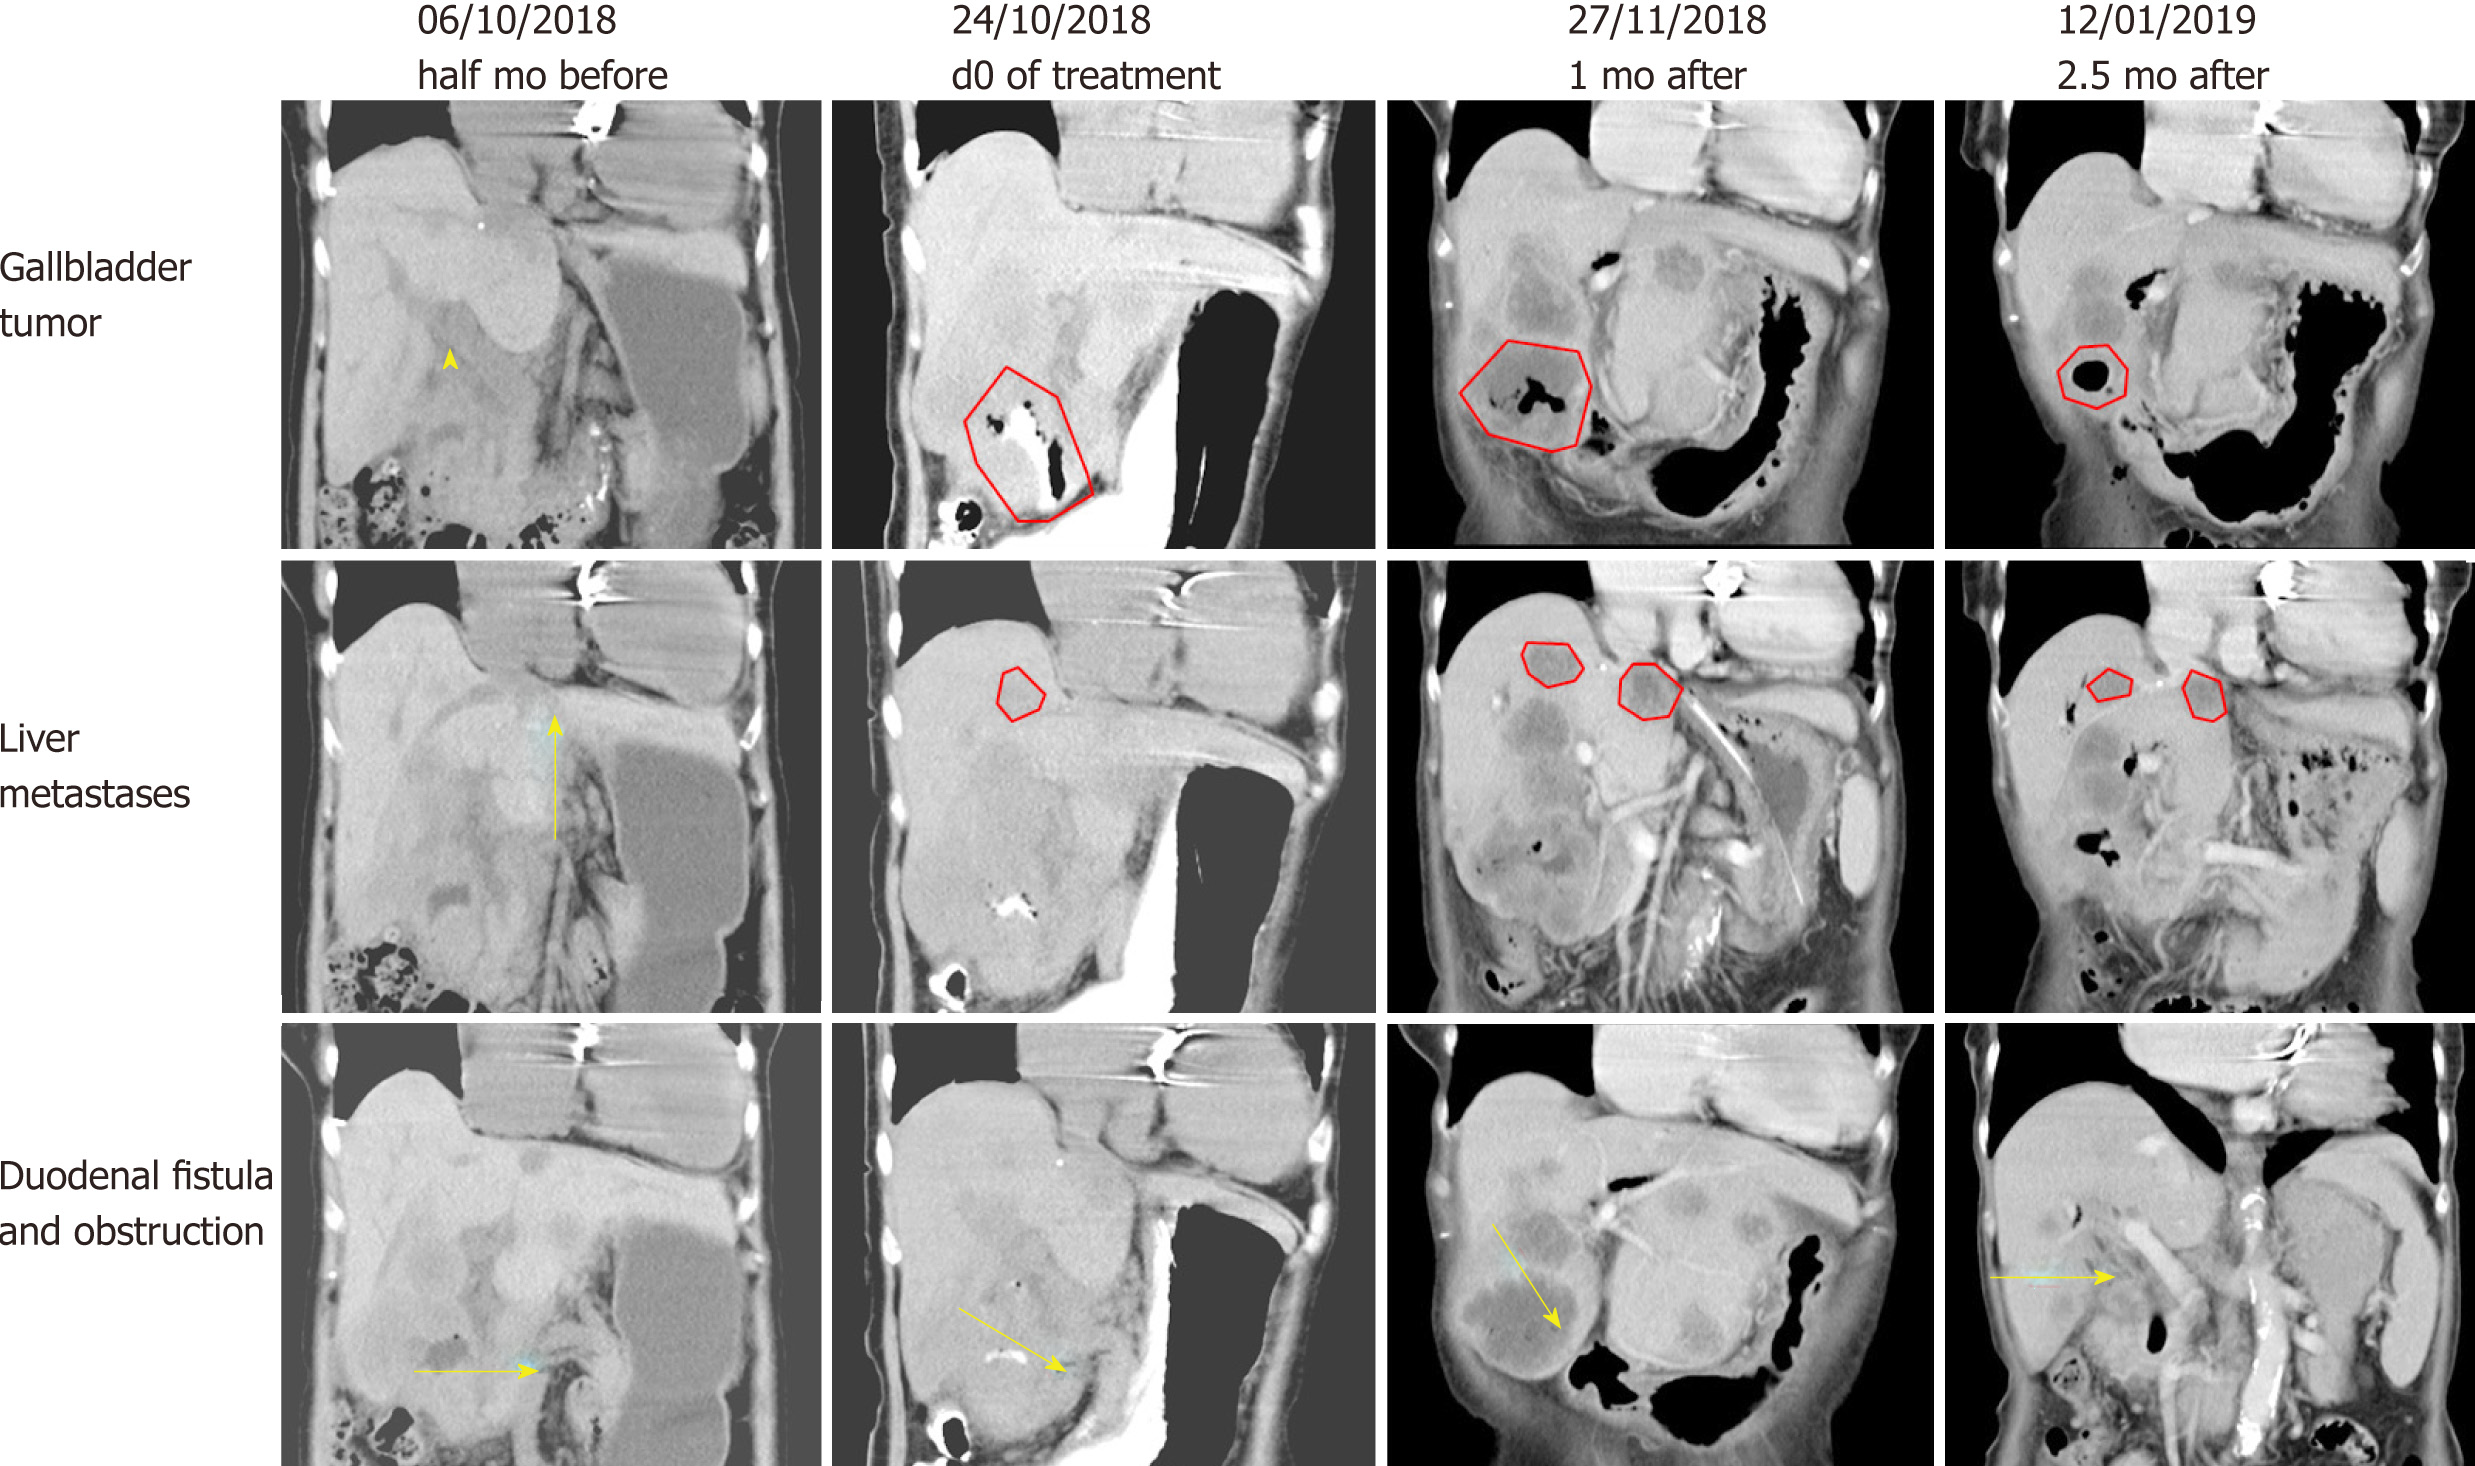
Figure 3 Computed tomography imaging findings at different time points before and after hydrogen treatment.
In the first line of figures, the triangle and the contour lines represent the location and range of the gallbladder. In the second line of figures, the contour lines represent the location and range of liver metastases. In the third line of figures, the arrows represent the location of the duodenal fistula or obstruction.
- Citation: Chen JB, Pan ZB, Du DM, Qian W, Ma YY, Mu F, Xu KC. Hydrogen gas therapy induced shrinkage of metastatic gallbladder cancer: A case report. World J Clin Cases 2019; 7(15): 2065-2074
- URL: https://www.wjgnet.com/2307-8960/full/v7/i15/2065.htm
- DOI: https://dx.doi.org/10.12998/wjcc.v7.i15.2065


