Copyright
©The Author(s) 2016.
World J Clin Cases. Jul 16, 2016; 4(7): 172-176
Published online Jul 16, 2016. doi: 10.12998/wjcc.v4.i7.172
Published online Jul 16, 2016. doi: 10.12998/wjcc.v4.i7.172
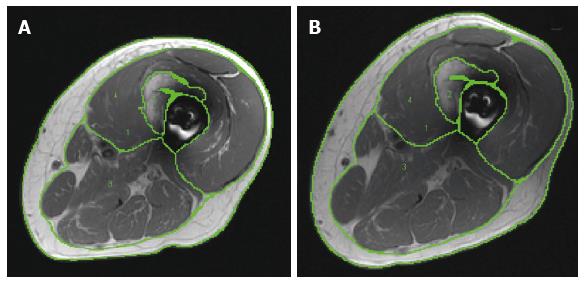
Figure 1 Representative magnetic resonance images of (A) pre- and (B) post-intervention showing different regions of interest (1) whole thigh skeletal muscle cross-sectional areas; (2) Heterotopic ossification bone formation; (3) posterior and medial compartments mid-thigh muscles; (4) knee extensor cross-sectional area.
Figure 2 The cross-sectional area of heterotopic ossification size from hip to knee in (A) and (B).
Note that the CSA in (A) is larger than in (B) because we could not separate the subperiosteal femoral bone from HO formation. CSA: Cross-sectional area; HO: Heterotopic ossification.
- Citation: Moore PD, Gorgey AS, Wade RC, Khalil RE, Lavis TD, Khan R, Adler RA. Neuromuscular electrical stimulation and testosterone did not influence heterotopic ossification size after spinal cord injury: A case series. World J Clin Cases 2016; 4(7): 172-176
- URL: https://www.wjgnet.com/2307-8960/full/v4/i7/172.htm
- DOI: https://dx.doi.org/10.12998/wjcc.v4.i7.172


