Copyright
©The Author(s) 2024.
World J Clin Cases. Mar 26, 2024; 12(9): 1606-1621
Published online Mar 26, 2024. doi: 10.12998/wjcc.v12.i9.1606
Published online Mar 26, 2024. doi: 10.12998/wjcc.v12.i9.1606
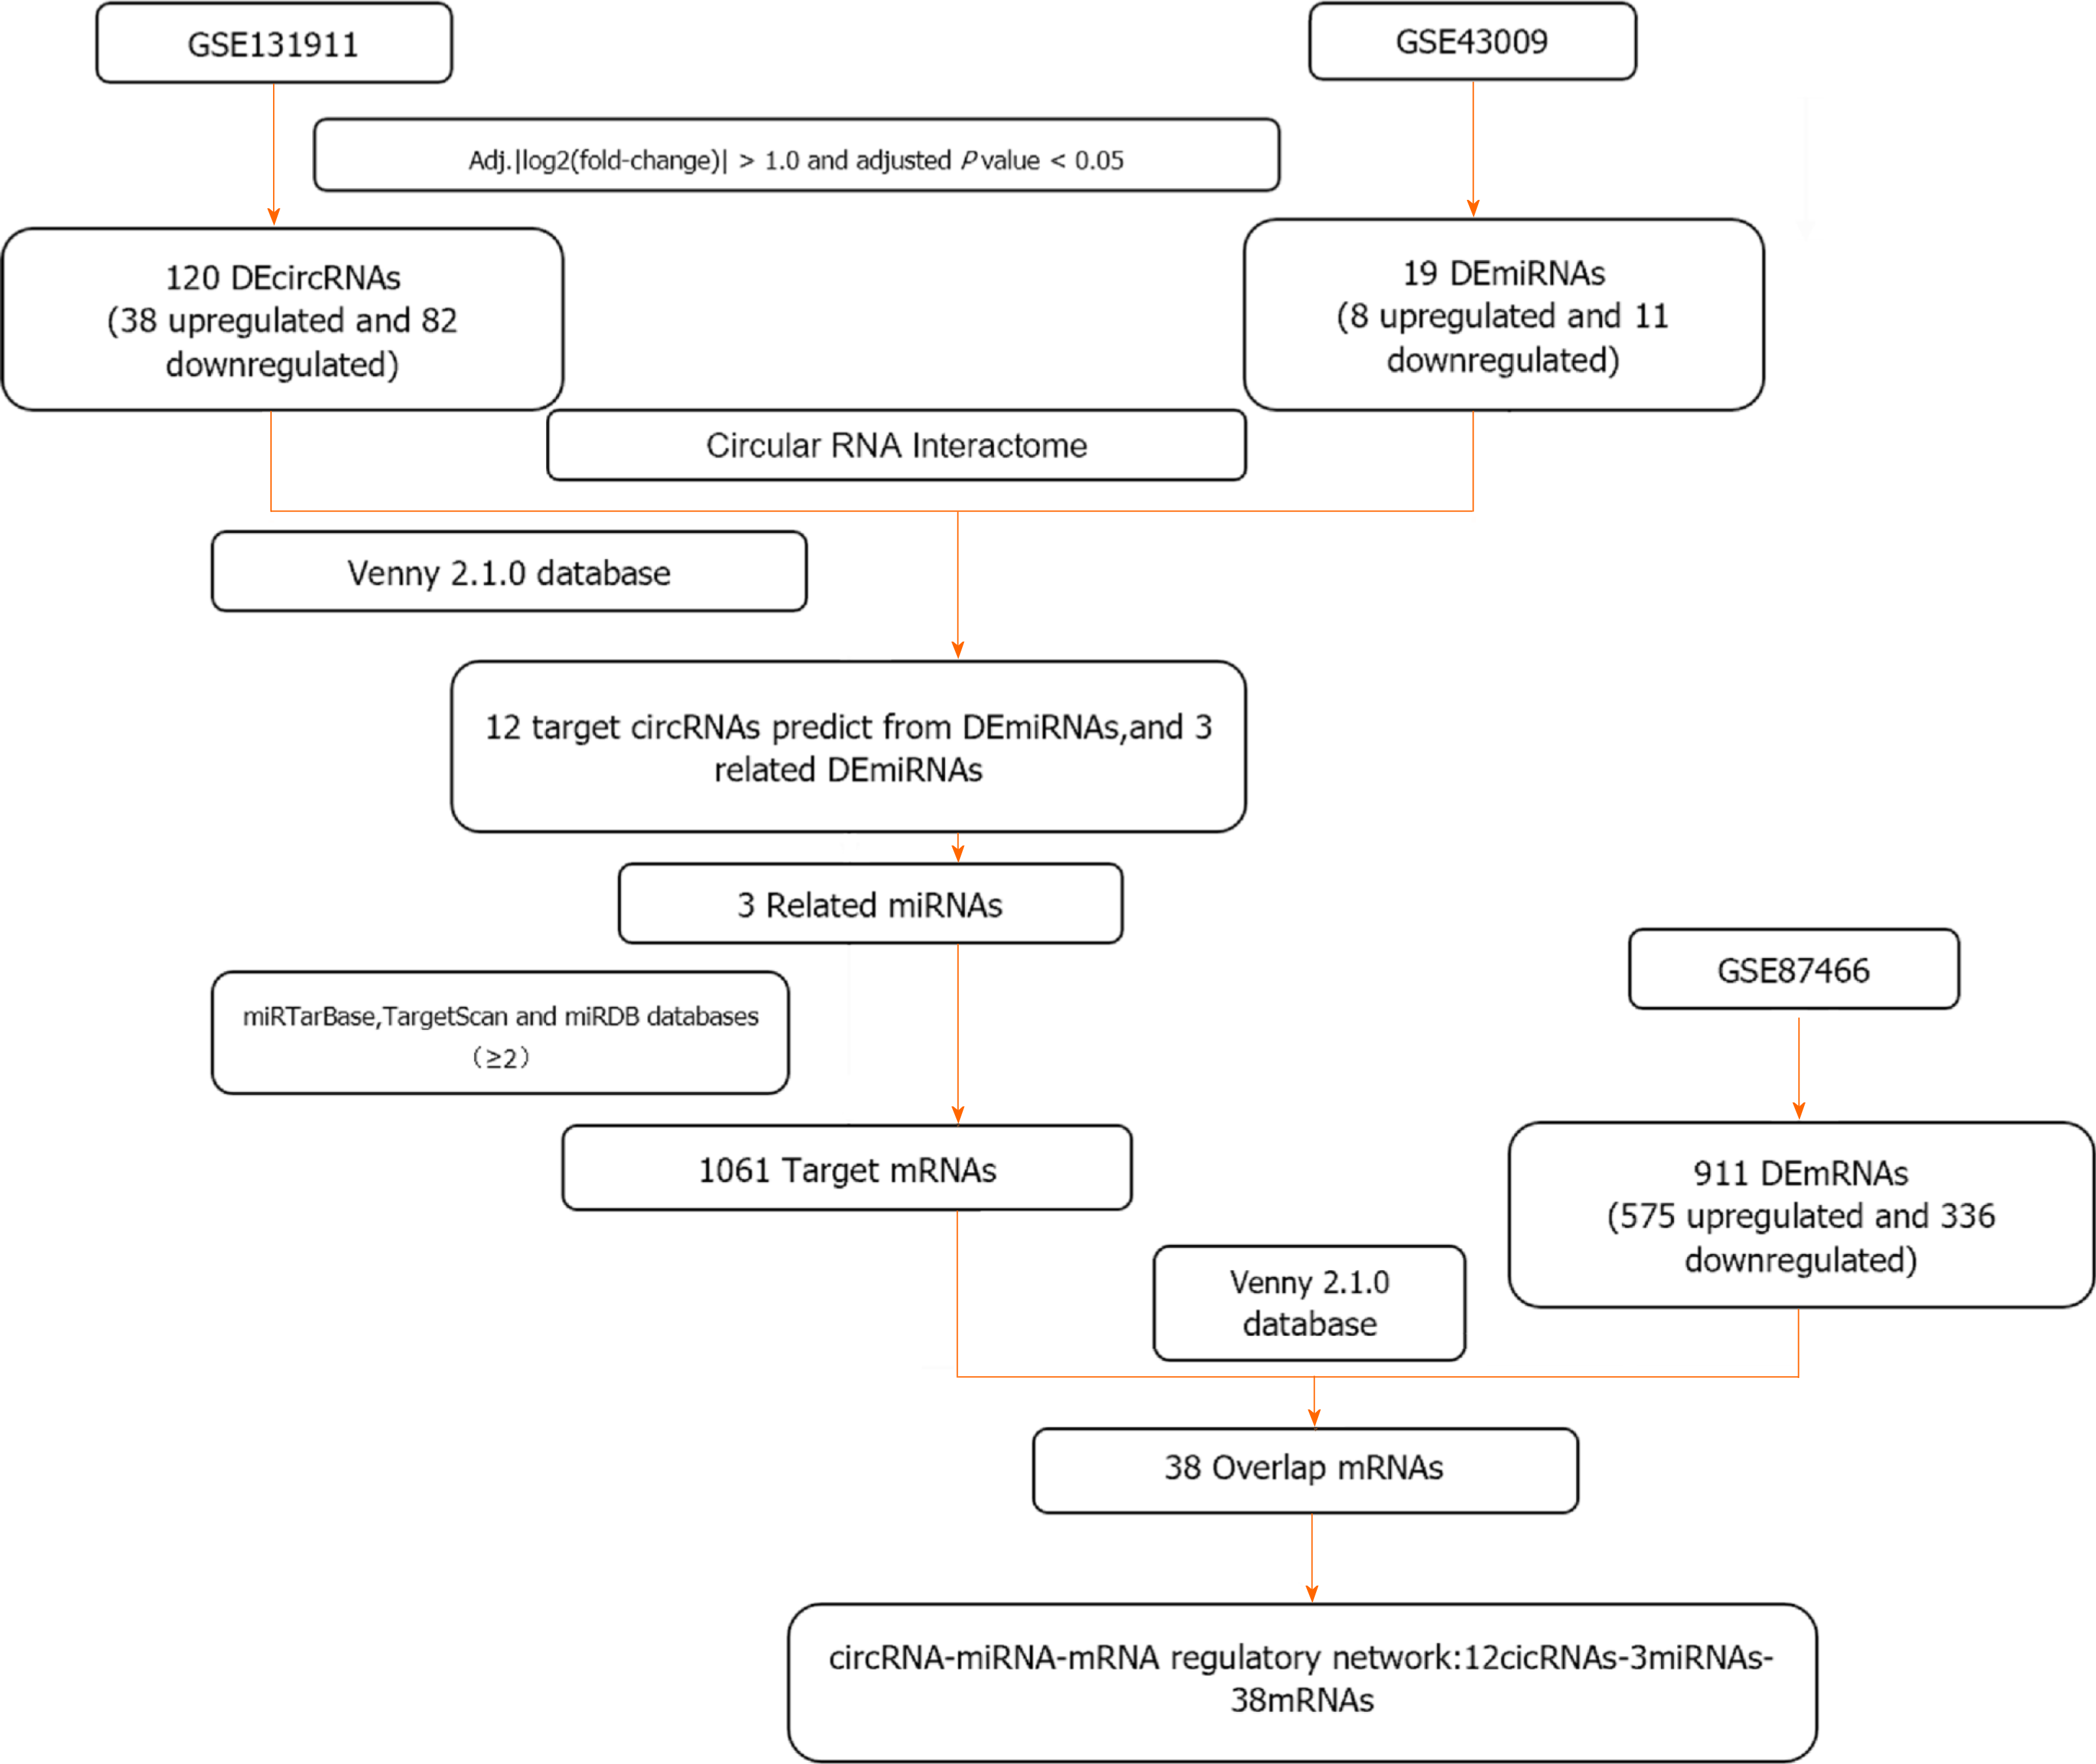
Figure 1
Flow chart screening process of the circRNA-miRNA-mRNA regulatory network.
Figure 2 Heatmap and volcano plots.
A: Differentially expressed circRNAs; B: Differentially expressed miRNAs; C: Differentially expressed mRNAs.
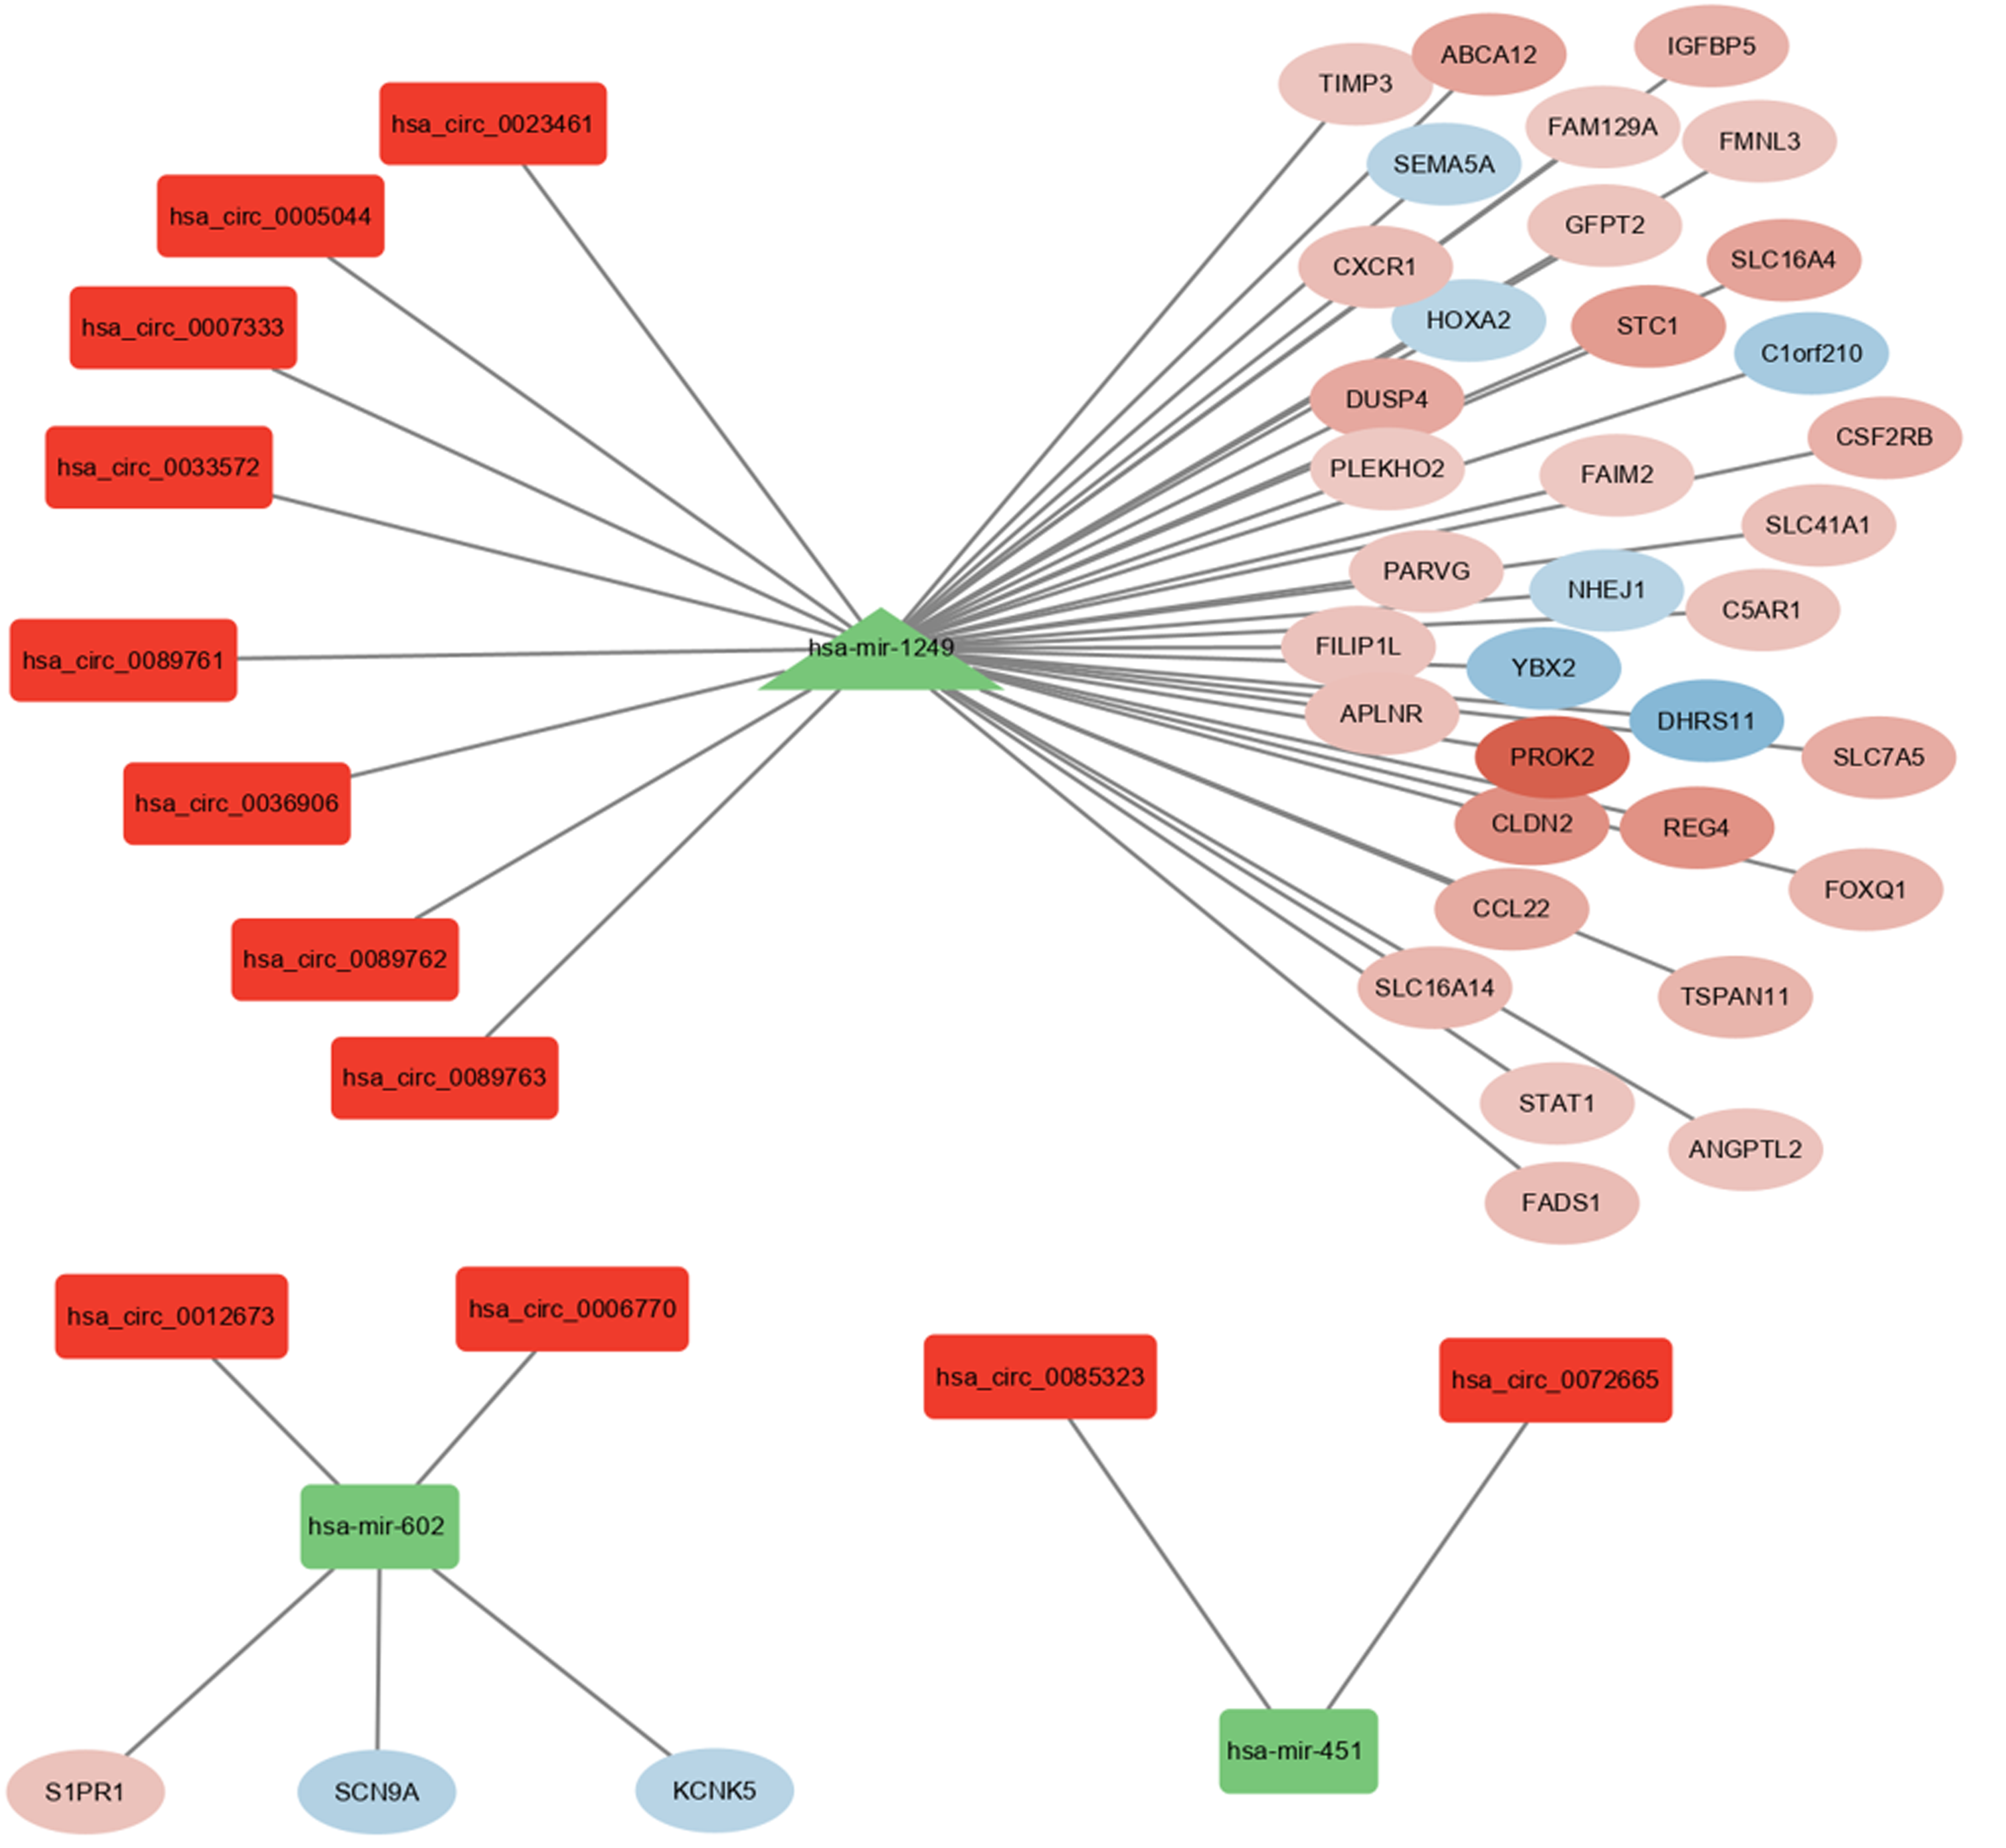
Figure 3 circRNA-miRNA-mRNA network in ulcerative colitis.
The red rectangle represents circRNAs, the green triangle represents miRNAs, and the ellipses whose colours change continuously according to the LogFC value represent mRNAs. Red and green mean upregulated and downregulated expression, respectively.
Figure 4 Gene Ontology and Kyoto Encyclopedia of Genes and Genomes pathway analyses of 38 mRNAs in the network.
A: The barplot and bubble plot of Gene Ontology analysis; B: The barplot and bubble plot of the Kyoto Encyclopedia of Genes and Genomes pathway.
Figure 5 Model diagnostic factors screened by least absolute shrinkage and selection operator.
A: The optimal parameter (λ) selection in the least absolute shrinkage and selection operator model used five-fold cross-validation via minimum criteria. The partial likelihood deviation (binomial deviation) curve was plotted against log(λ). A dashed vertical line was drawn at the optimal value using the smallest criterion and 1 SE of the smallest criterion (1-SE criterion); B: A coefficient distribution map was generated for log(λ), where the optimal λ was the two features with nonzero coefficients.
Figure 6 Model establishment and efficacy verification.
A: Nomogram model constructed using hsa_circ_0085323 and hsa_circ_0036906; B: Model validation receiver operating characteristic curve; C: decision curve analysis curve for model efficacy test.
- Citation: Yuan YY, Wu H, Chen QY, Fan H, Shuai B. Construction of the underlying circRNA-miRNA-mRNA regulatory network and a new diagnostic model in ulcerative colitis by bioinformatics analysis. World J Clin Cases 2024; 12(9): 1606-1621
- URL: https://www.wjgnet.com/2307-8960/full/v12/i9/1606.htm
- DOI: https://dx.doi.org/10.12998/wjcc.v12.i9.1606


