Copyright
©The Author(s) 2024.
World J Clin Cases. Apr 16, 2024; 12(11): 1918-1928
Published online Apr 16, 2024. doi: 10.12998/wjcc.v12.i11.1918
Published online Apr 16, 2024. doi: 10.12998/wjcc.v12.i11.1918
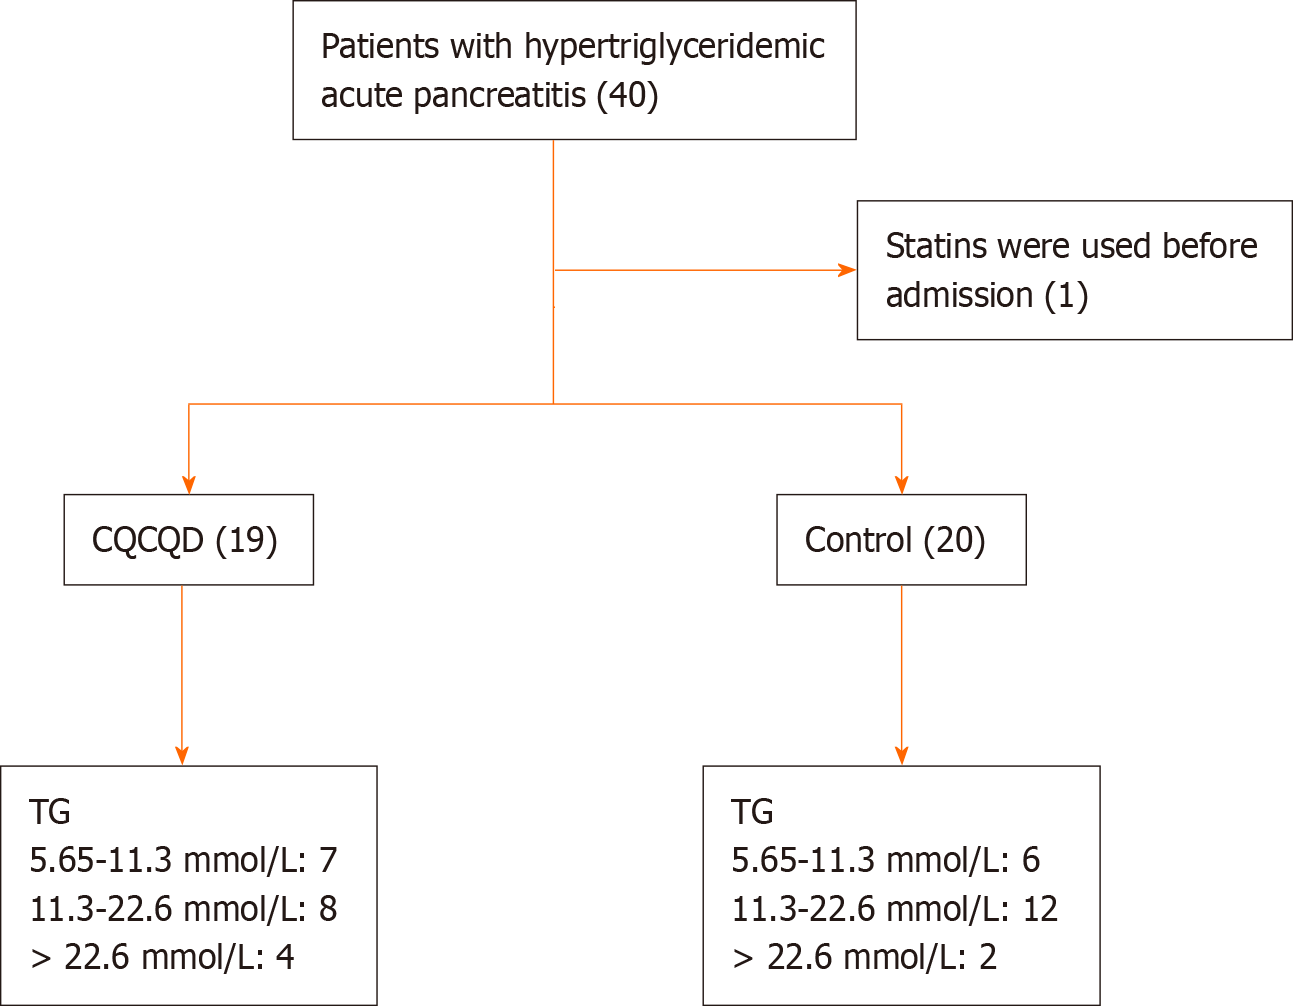
Figure 1 A flowchart depicting the patient selection process.
CQCQD: Chaiqin Chengqi Decoction; TG: Triglyceride.
Figure 2 The alterations in lipid levels pre- and post-treatment.
A: Changes in triglyceride (TG), cholesterol and high density lipoprotein cholesterol levels before and after treatment; B: Changes in TG levels before and after treatment in the Chaiqin Chengqi Decoction group; C: Changes in TG levels before and after treatment in the control group; D: Changes in apolipoprotein A1 and apolipoprotein B levels before and after treatment. aP < 0.05. TG: Triglyceride; CHO: Cholesterol; HDL-C: High density lipoprotein cholesterol; APOA1: Apolipoprotein A1; APOB: Apolipoprotein B; CQCQD: Chaiqin Chengqi Decoction.
Figure 3 Analysis of bowel recovery and abdominal pain relief.
aP < 0.05. CQCQD: Chaiqin Chengqi Decoction.
Figure 4 Analysis of acute gastrointestinal injury score and number of bowel movements after treatment.
A: Comparison of defecating frequency between the two groups after 3 d of treatment; B: Comparison of acute gastrointestinal injury between the two groups after 3 d of treatment. aP < 0.05. AGI: Acute gastrointestinal injury; CQCQD: Chaiqin Chengqi Decoction.
Figure 5 Analysis of duration of symptoms.
A: Curves for time without relief from abdominal pain; B: Curves for time without resumption of defecation.
Figure 6 Analysis of the degree of decrease in C-reactive protein.
aP < 0.05. CRP: C-reactive protein; CQCQD: Chaiqin Chengqi Decoction.
Figure 7 Changes of Balthazar score before and after treatment.
CQCQD: Chaiqin Chengqi Decoction.
- Citation: Zhang HF, Su ZX, Feng YH, Li SJ, Xie BY. Chaiqin Chengqi Decoction as an adjuvant treatment for mild/moderately severe hypertriglyceridemic acute pancreatitis: A retrospective study. World J Clin Cases 2024; 12(11): 1918-1928
- URL: https://www.wjgnet.com/2307-8960/full/v12/i11/1918.htm
- DOI: https://dx.doi.org/10.12998/wjcc.v12.i11.1918


