Copyright
©The Author(s) 2023.
World J Clin Cases. Jul 16, 2023; 11(20): 4800-4813
Published online Jul 16, 2023. doi: 10.12998/wjcc.v11.i20.4800
Published online Jul 16, 2023. doi: 10.12998/wjcc.v11.i20.4800
Figure 1 Risk model construction.
A: Seventeen fatty acid metabolism -related genes were visualized by Forrest plotting; B: Correlation test was applied to determine the co-occurrence; C: Mutation frequency were identified of aforementioned genes; D-E: Lasso regression model was established on account of 6 genes; F: High- and low-risk cohorts were generated by all fatty acid genes; G: High- and low-risk cohorts were grouped using principal component analysis. PC: Principal component.
Figure 2 Prognostic correlation of fatty acid metabolism -related genes risk score model and clinical features as well as overall survival in gastric cancer patients.
A-F: Correlation between risk score model and clinical characteristics comprising Age, Gender, Grade, M, N, T; G-H: Differences of overall survival between high- and low-risk cohorts from TCGA-cohort and GEO-cohort were detected; I: ROC curves were performed to identify the forecast value; J: Predictive correlation of the risk score as well as clinical features in TCGA-cohort; K-L: Univariate and multivariate cox regression models were proceeded to illustrate the prognostic value of the risk model.
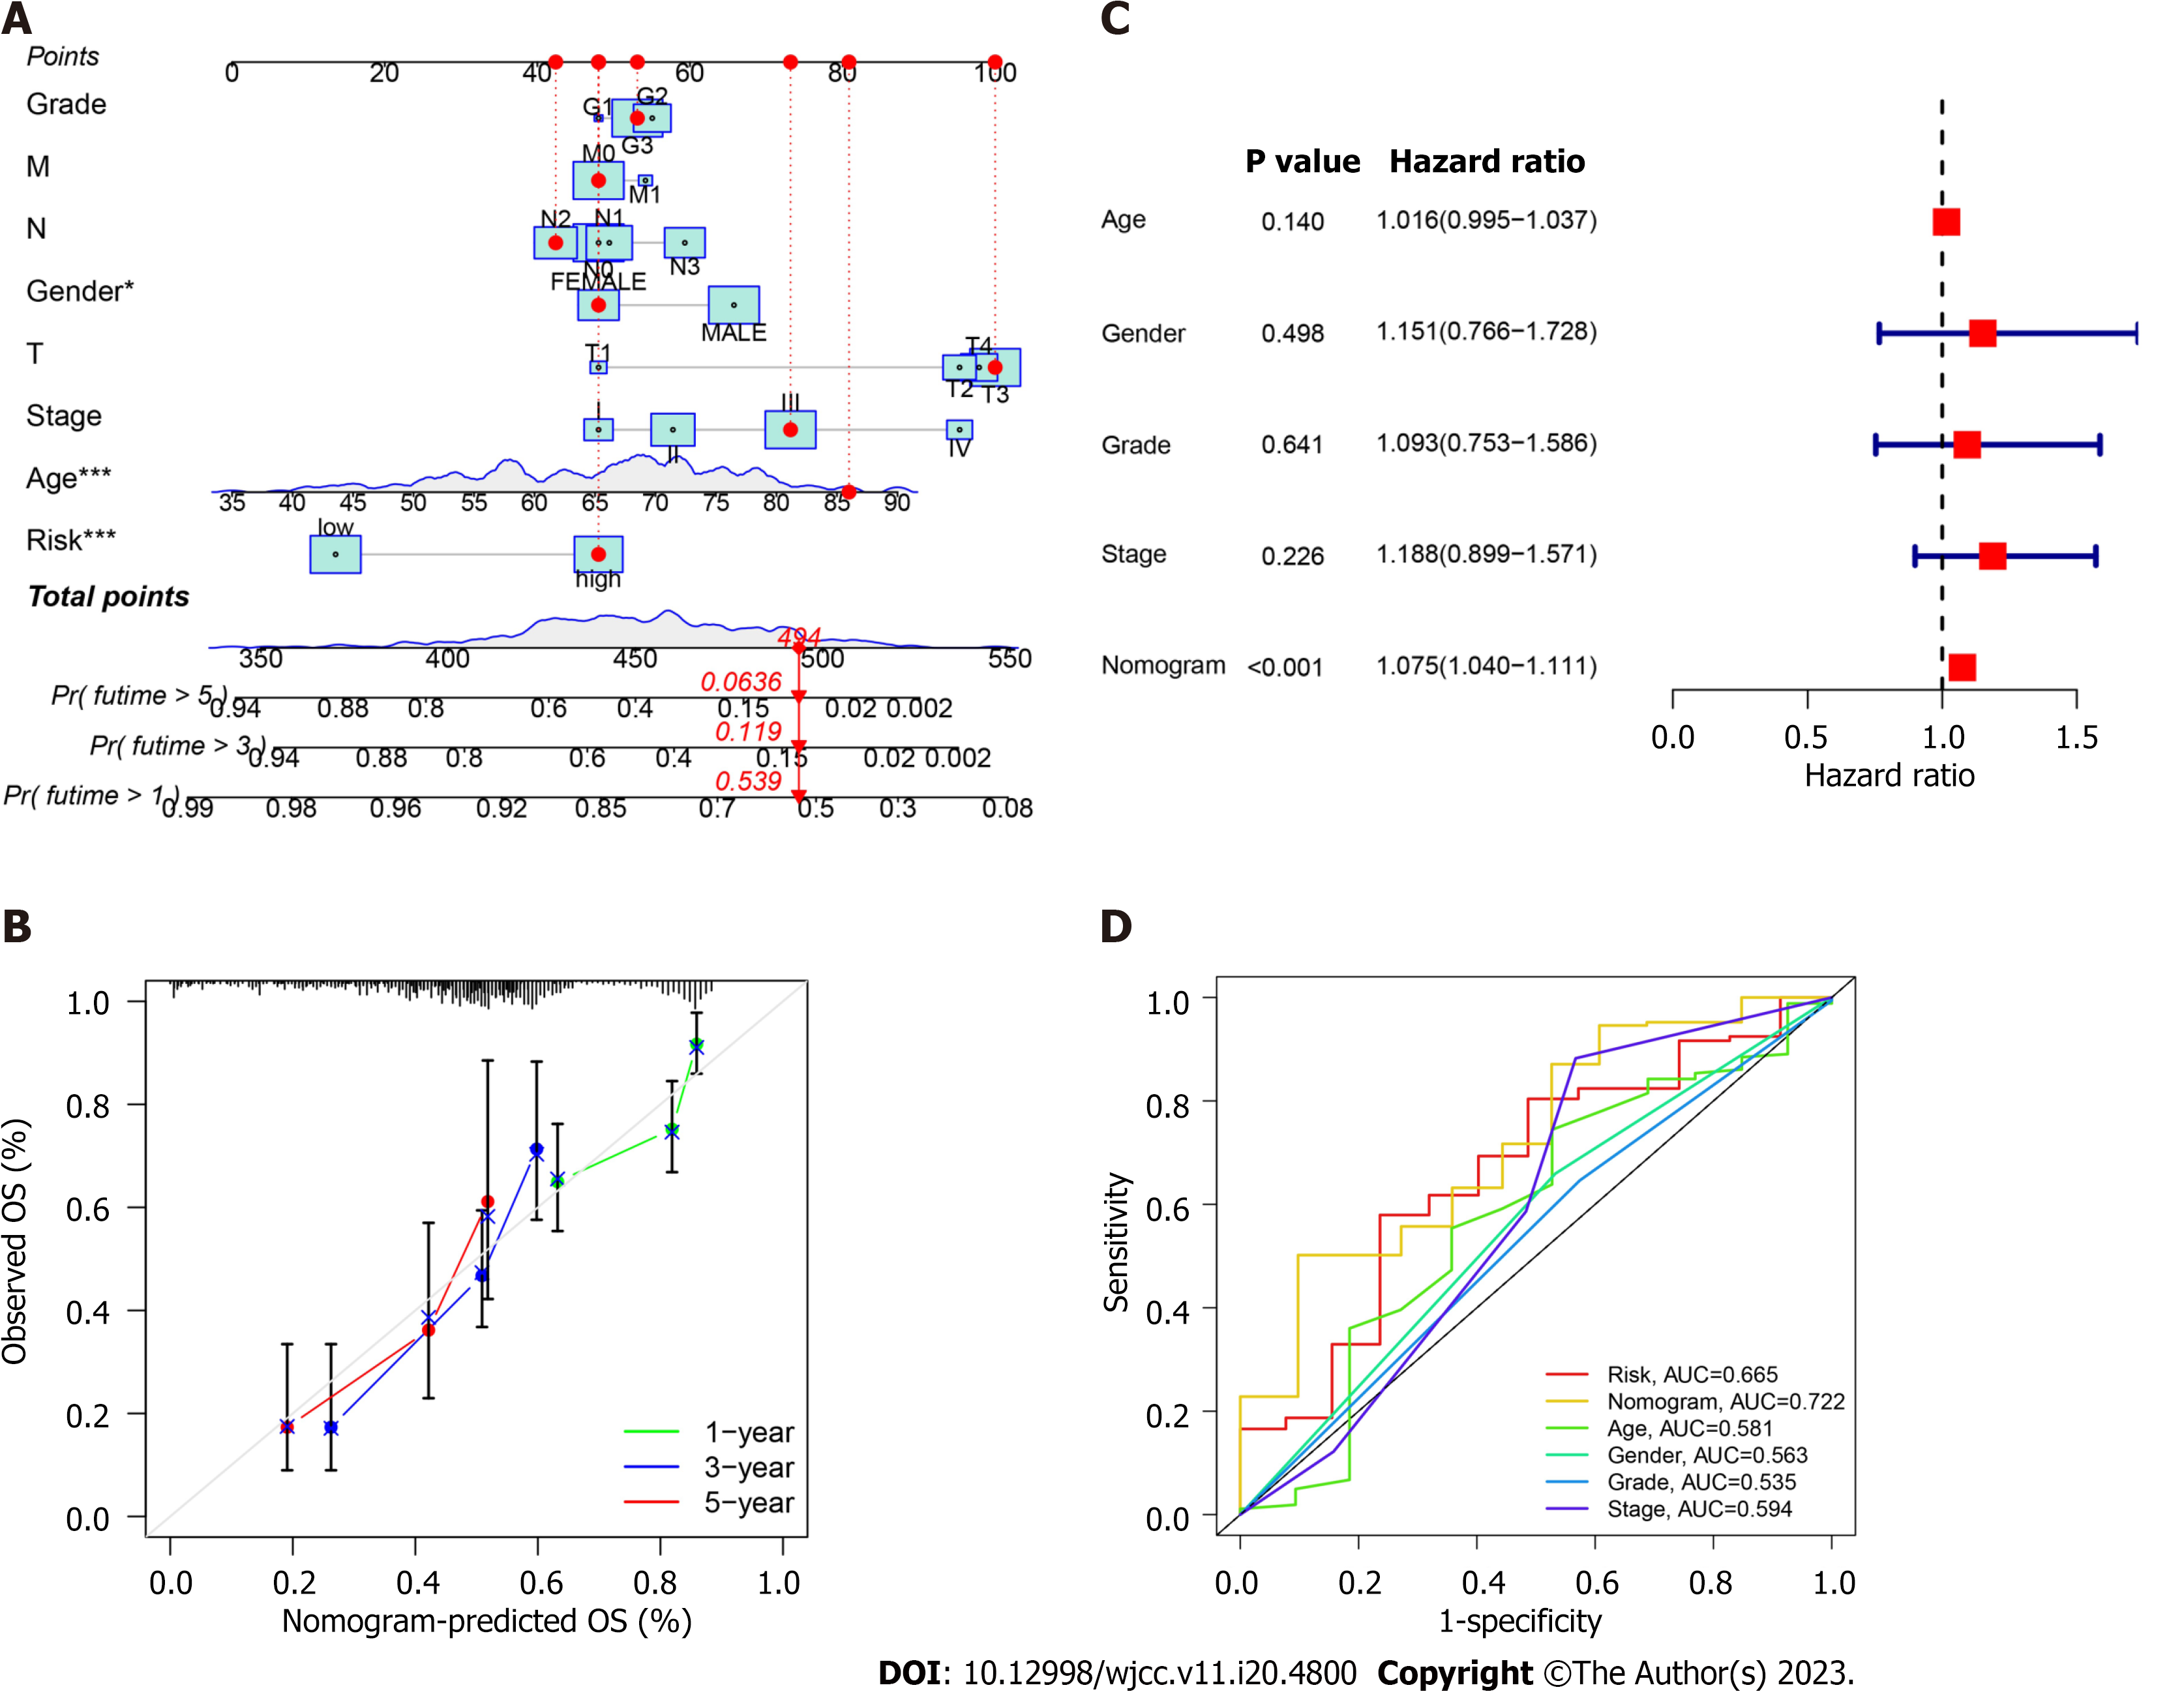
Figure 3 verification of the risk model in gastric cancer patients.
A. nomogram was plotted based on the Cancer Genome Atlas -cohort; B: Calibration of nomogram was calculated; C: Cox regression analysis of the nomogram; D: Receiver operating characteristic curves were drawn to identify the forecast value of nomogram.
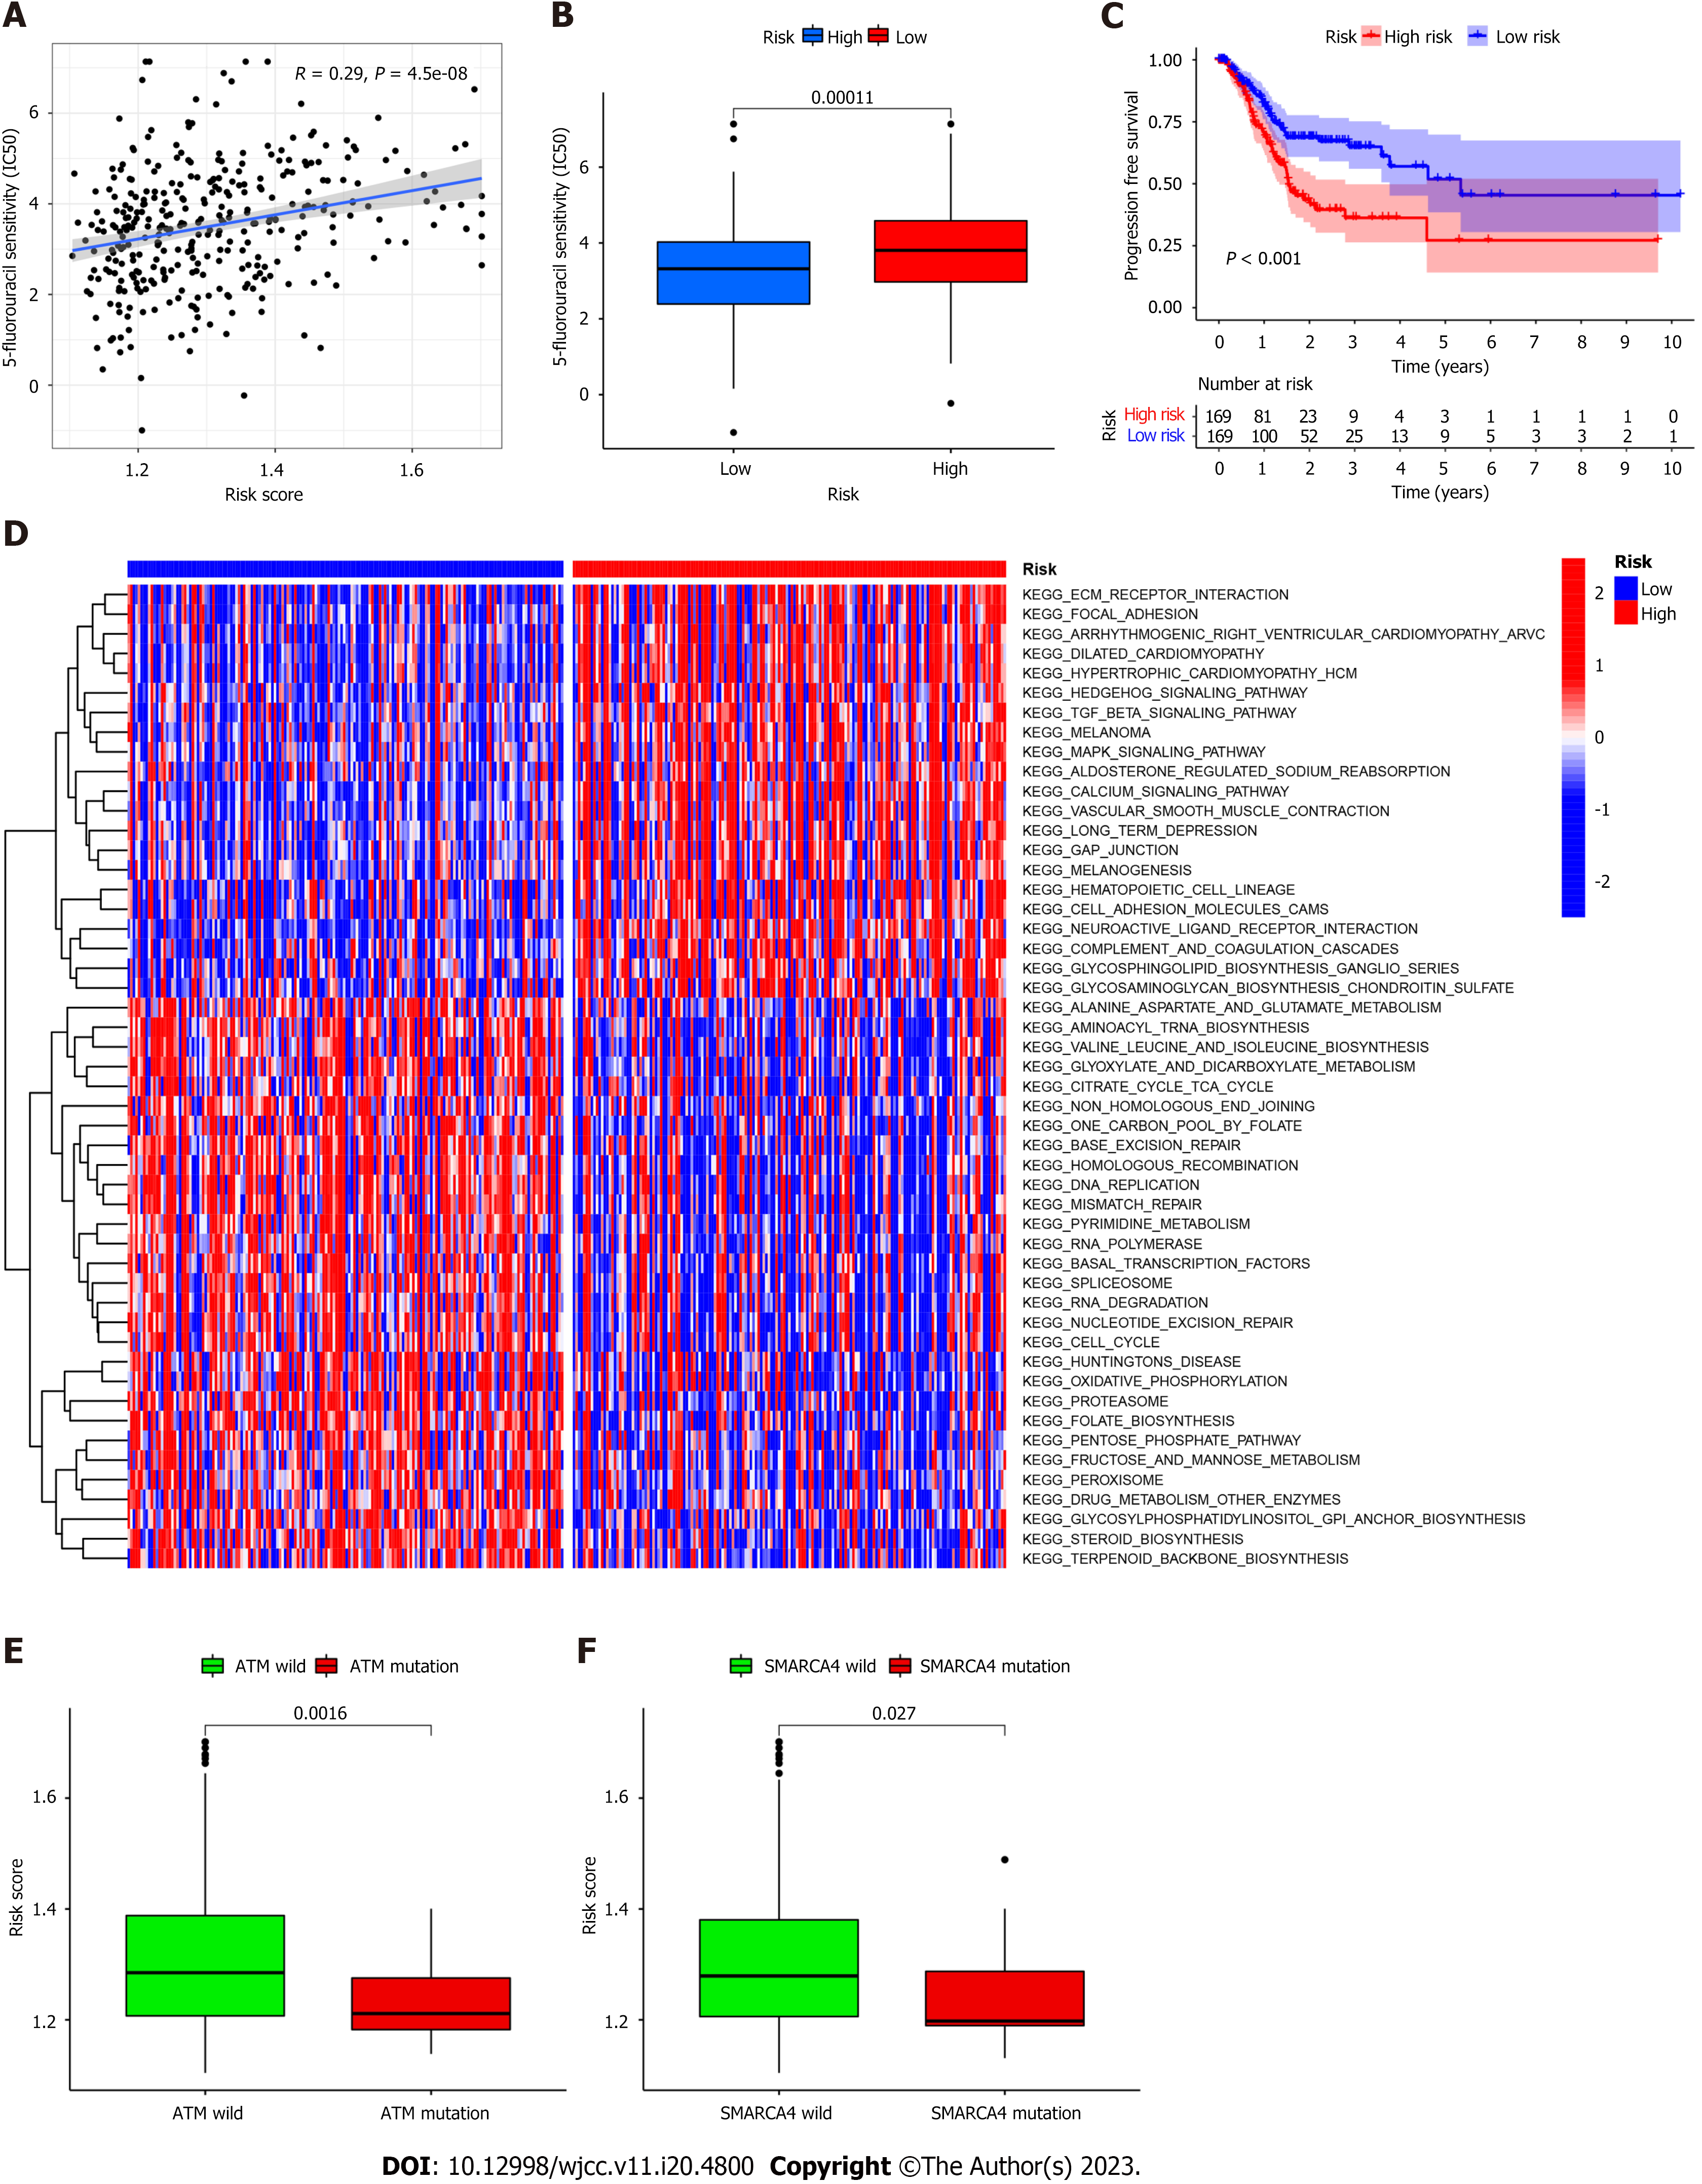
Figure 4 Correlation of risk score and therapeutic strategies.
A: Relationship between risk score and 5-fluorouracil sensitivity; B: Correlation of risk score and evaluated IC50 of 5-fluorouracil; C: Progression free survival between high- and low- risk cohorts; D: Gene set variation analysis enrichment analysis in high- and low-risk cohorts; E-F: Differences of immune activity related genes consisting of ataxia telangiectasia mutated and SMARCA4.
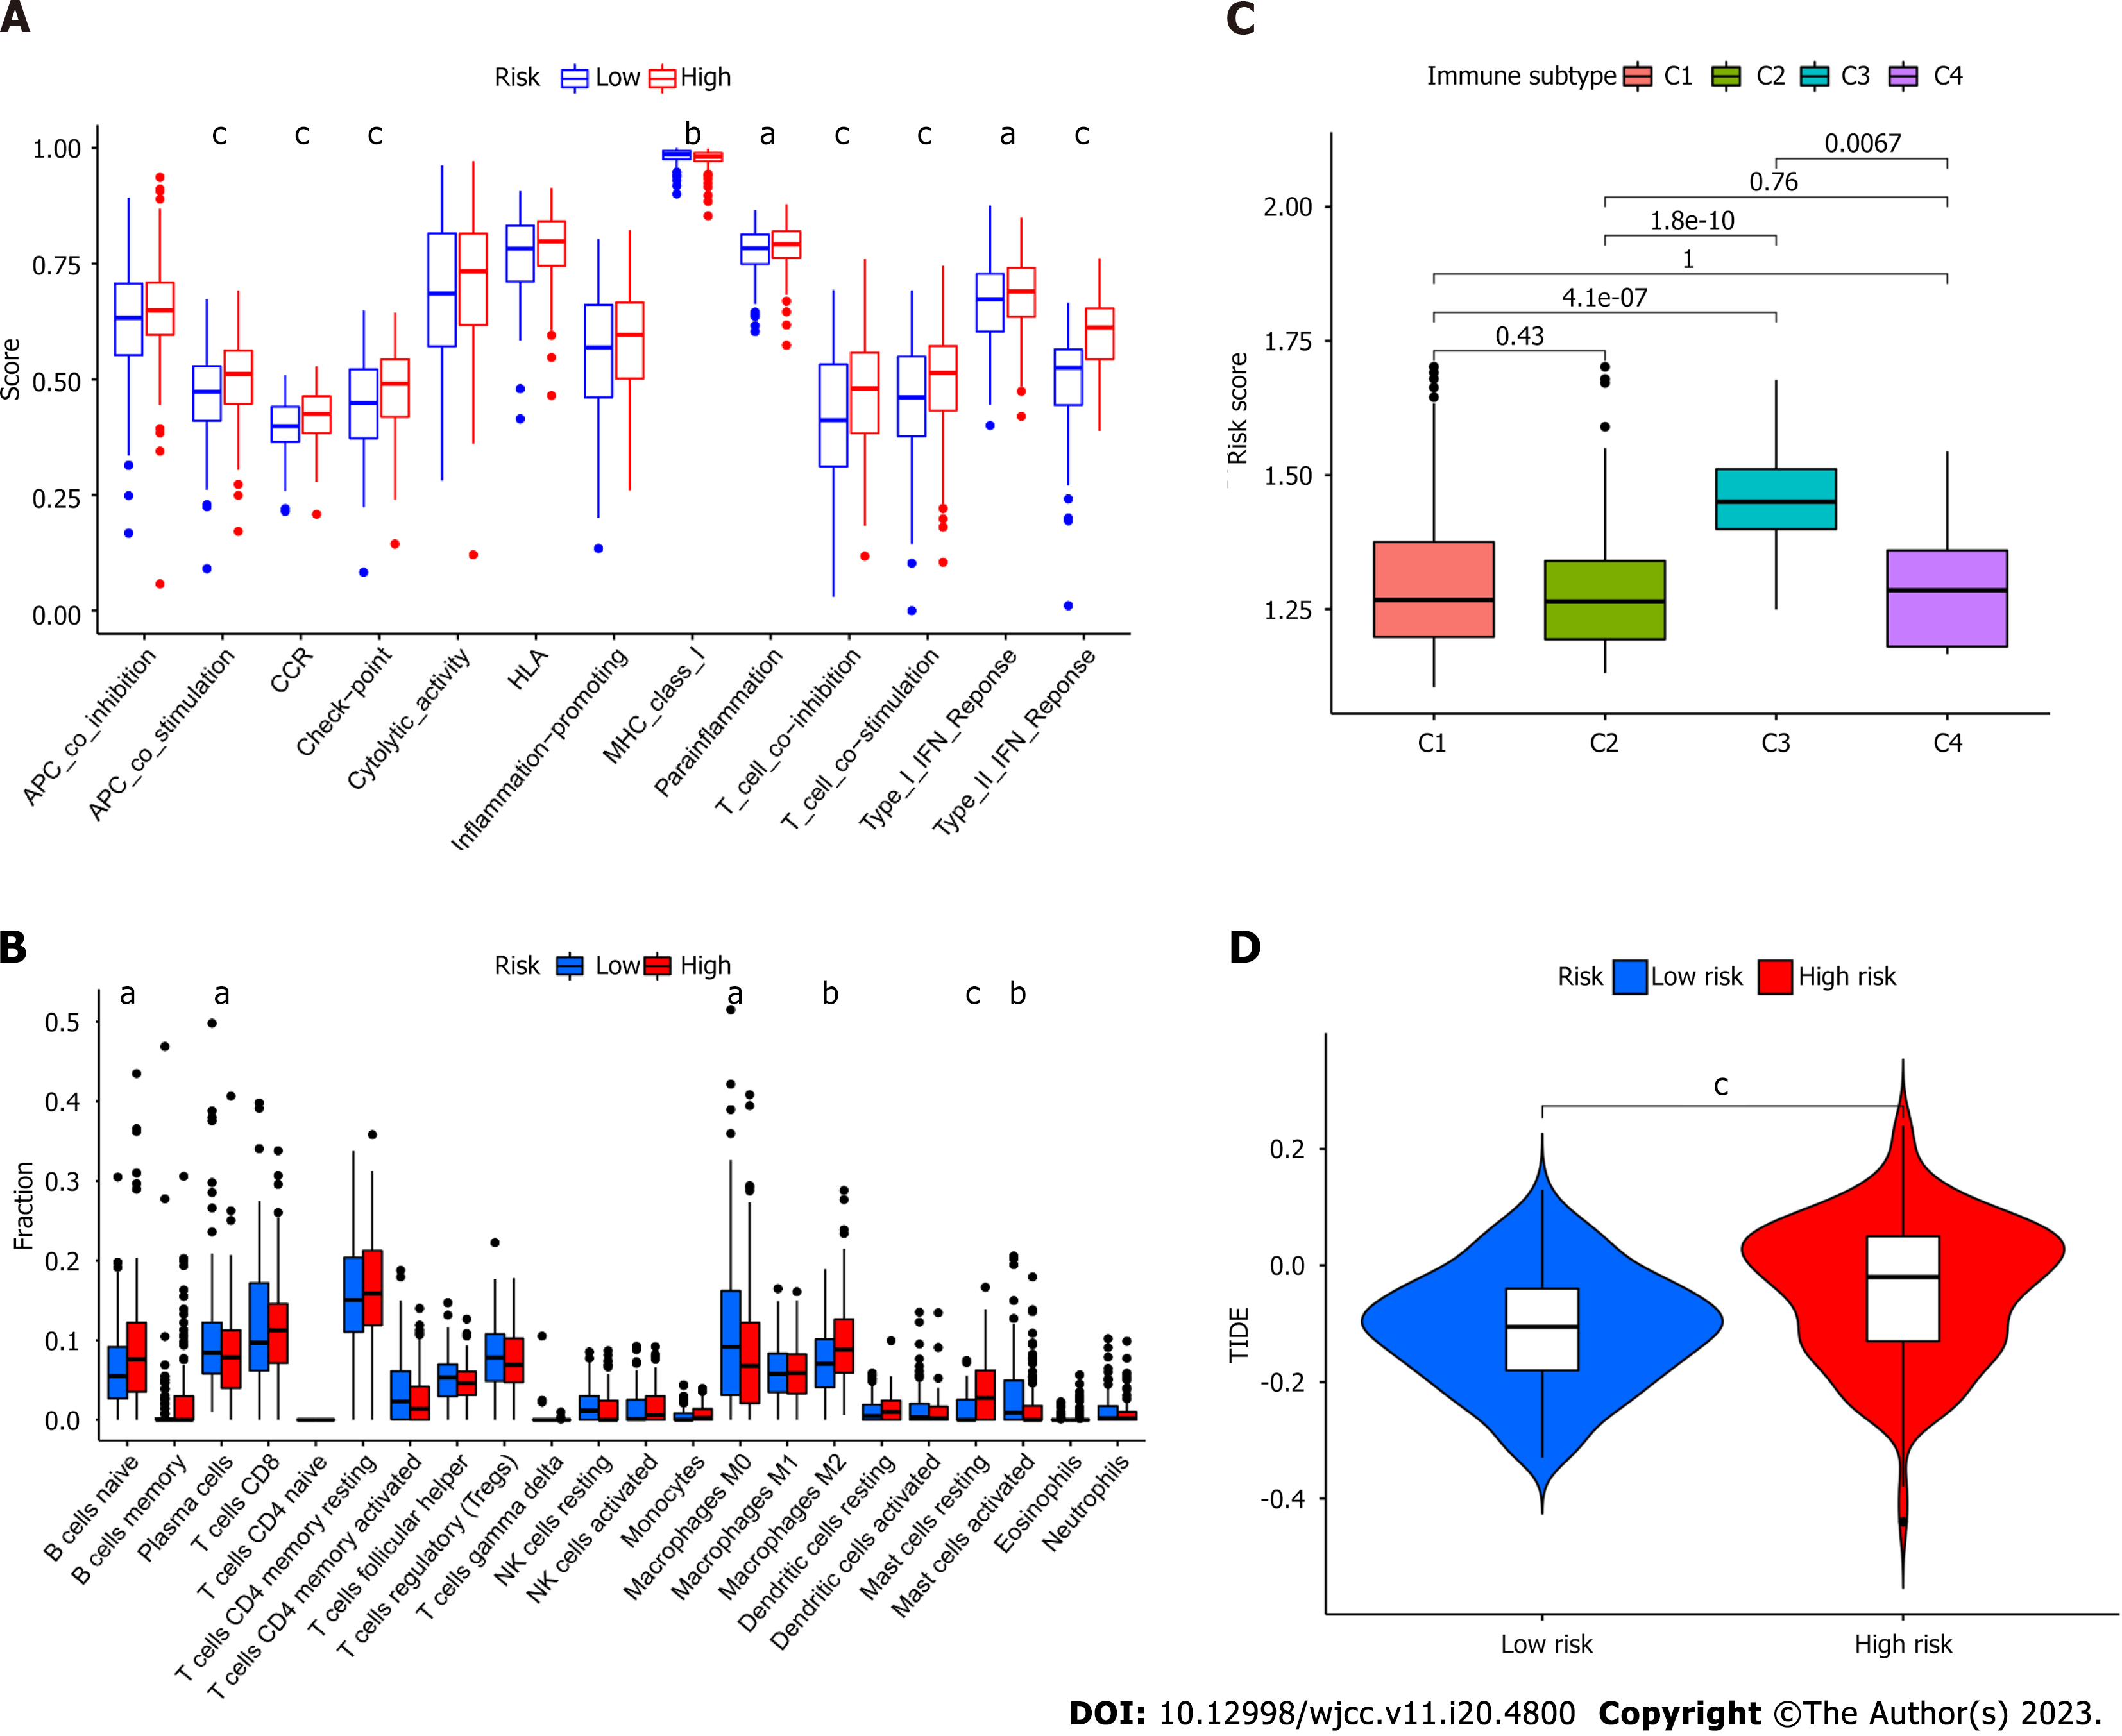
Figure 5 Activity of fatty acid metabolism related risk model in the context of tumor immune infiltration.
A: Immune cell function in high- and low-risk cohorts; B: Immune cell infiltration in high- and low-risk cohorts; C: Relationship between risk score and immune subtypes using clustering analysis; D: Correlation between risk score and Tumor Immune Dysfunction and Exclusion. aP < 0.05, bP < 0.01, cP < 0.001.
Figure 6 Construction of protein-protein interaction network.
A: Protein network established by String online database; B: Protein-protein network visualized by Cytoscape; C-D: Gene ontology and Kyoto Encyclopedia of Genes and Genomes enrichment analysis were performed containing top 10 genes; E-F: Survival analysis for patients layered by expression of fatty acid binding protein 4 and THBS1 mRNA expression.
- Citation: Fu Y, Wang B, Fu P, Zhang L, Bao Y, Gao ZZ. Delineation of fatty acid metabolism in gastric cancer: Therapeutic implications. World J Clin Cases 2023; 11(20): 4800-4813
- URL: https://www.wjgnet.com/2307-8960/full/v11/i20/4800.htm
- DOI: https://dx.doi.org/10.12998/wjcc.v11.i20.4800


