Copyright
©The Author(s) 2022.
World J Clin Cases. Nov 6, 2022; 10(31): 11466-11485
Published online Nov 6, 2022. doi: 10.12998/wjcc.v10.i31.11466
Published online Nov 6, 2022. doi: 10.12998/wjcc.v10.i31.11466
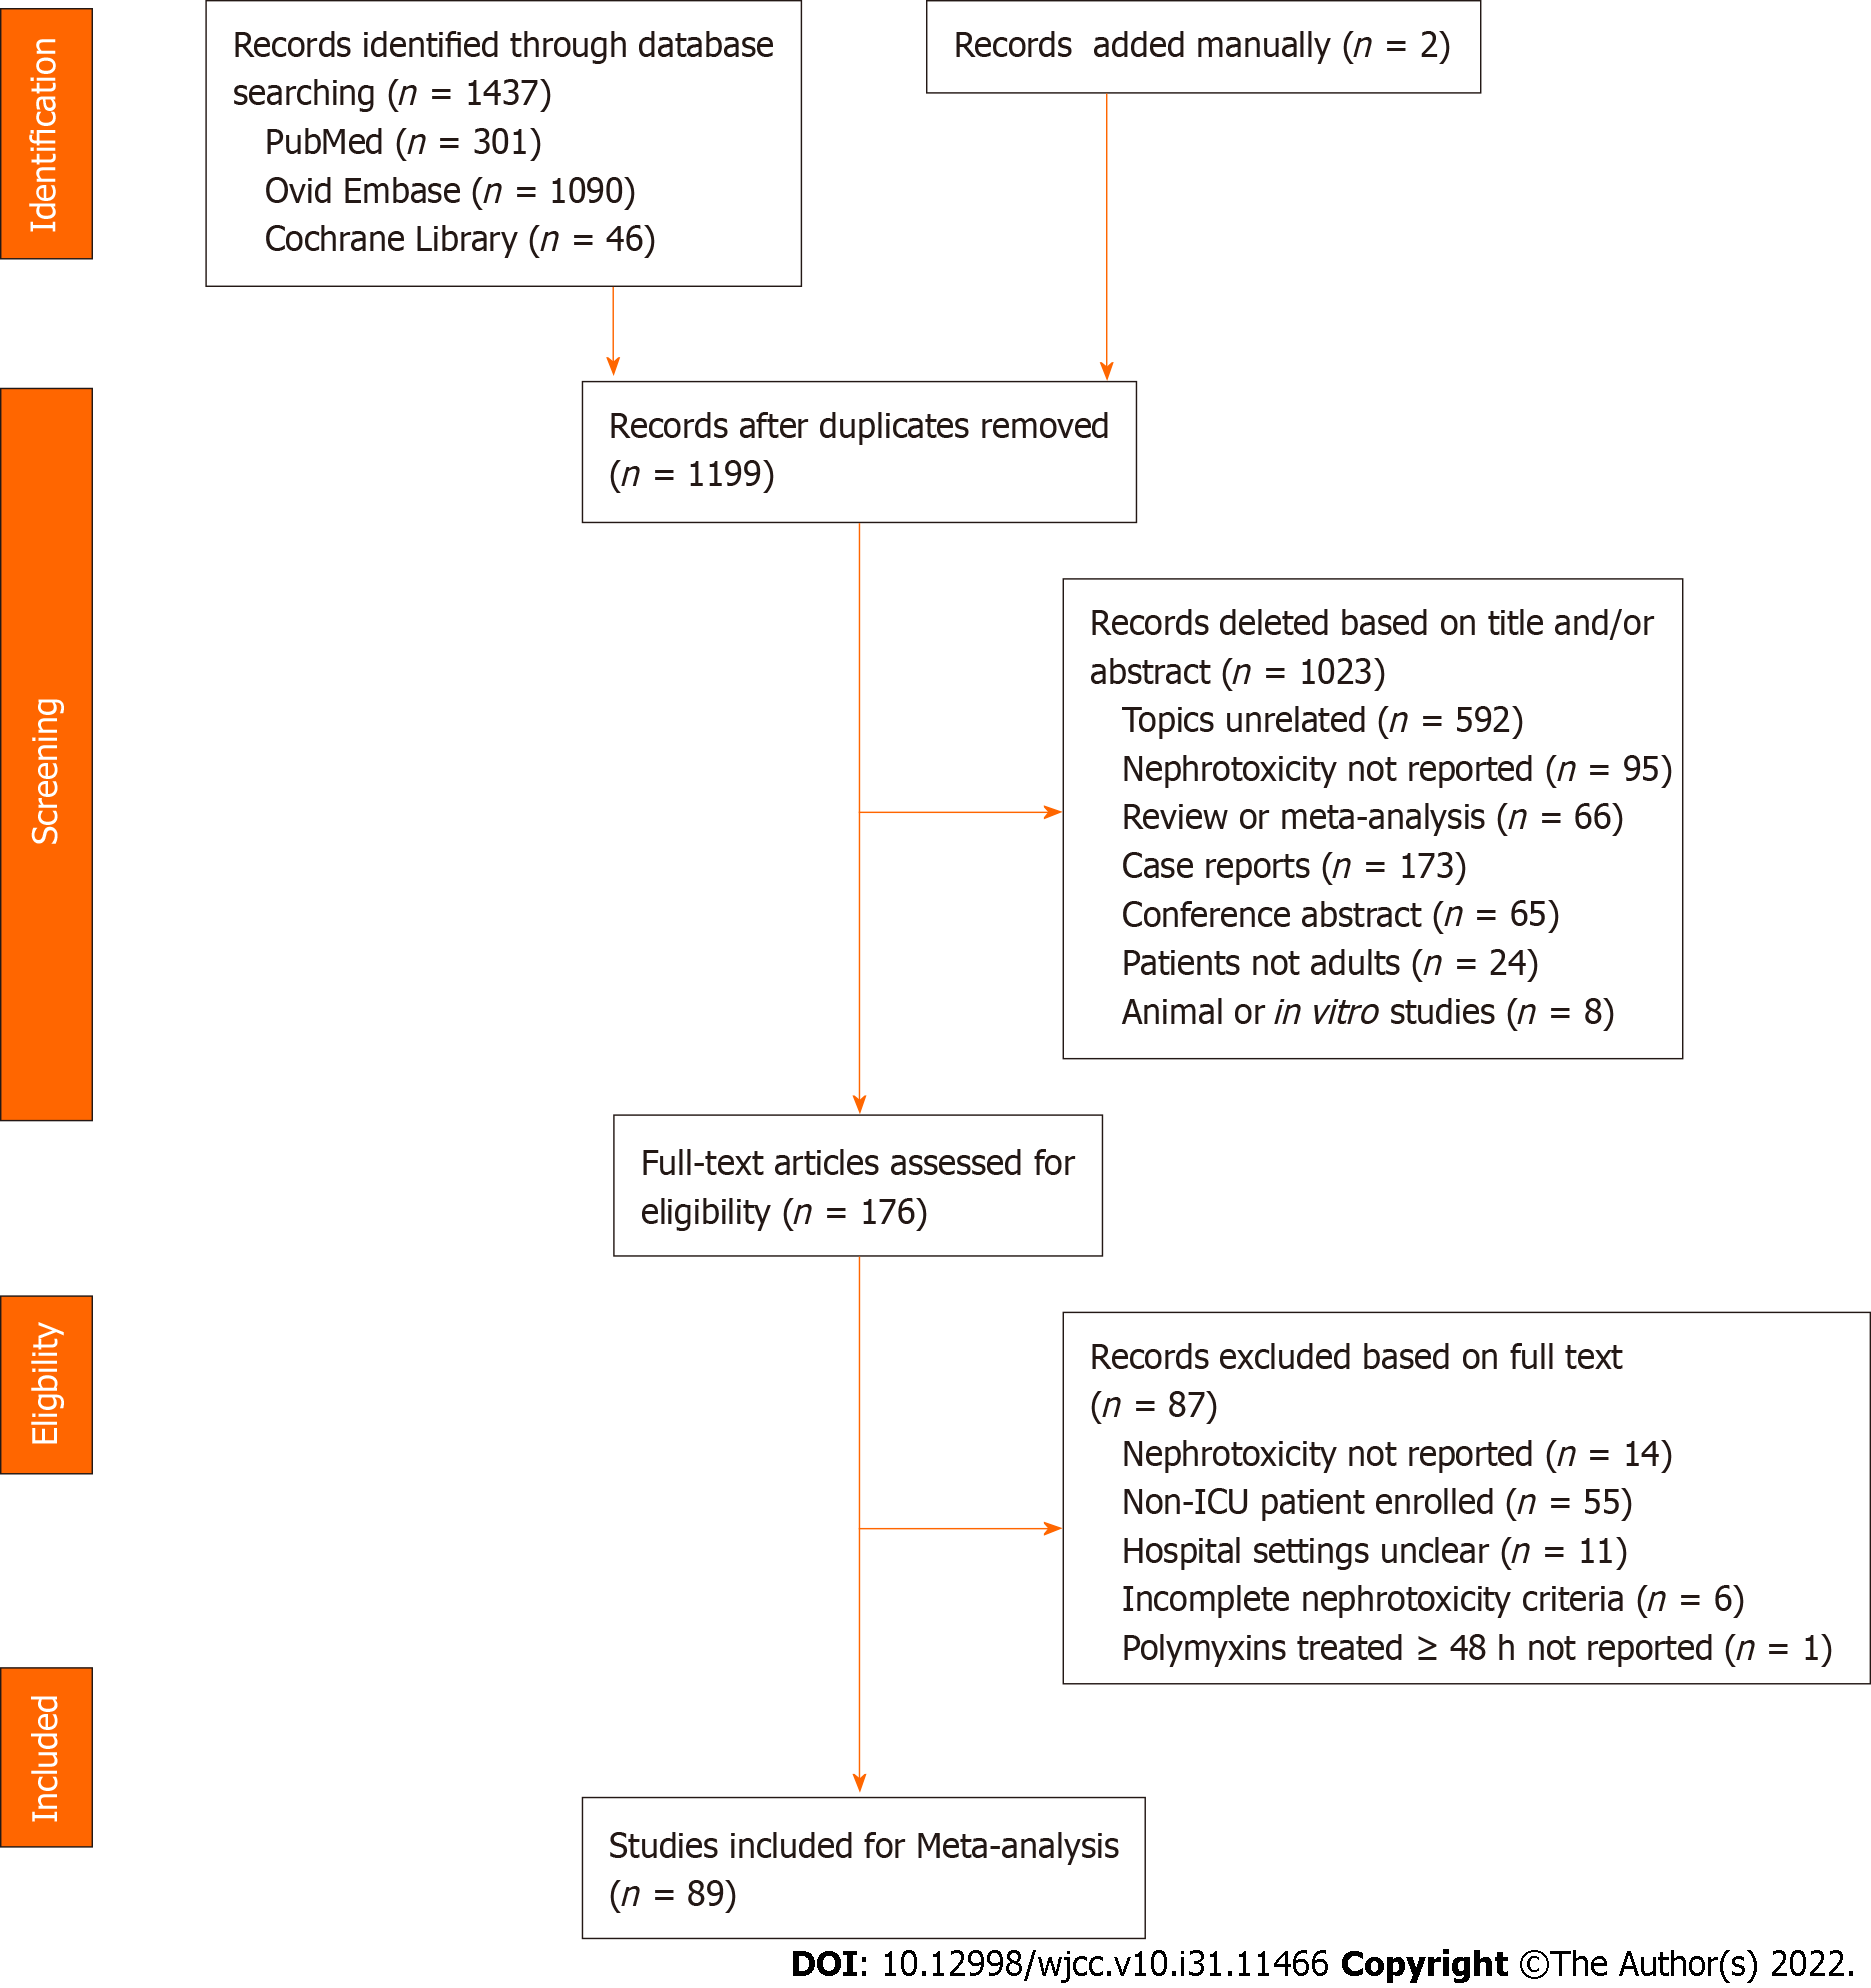
Figure 1 PRISMA flow diagram of study selection.
ICU: Intensive care unit.
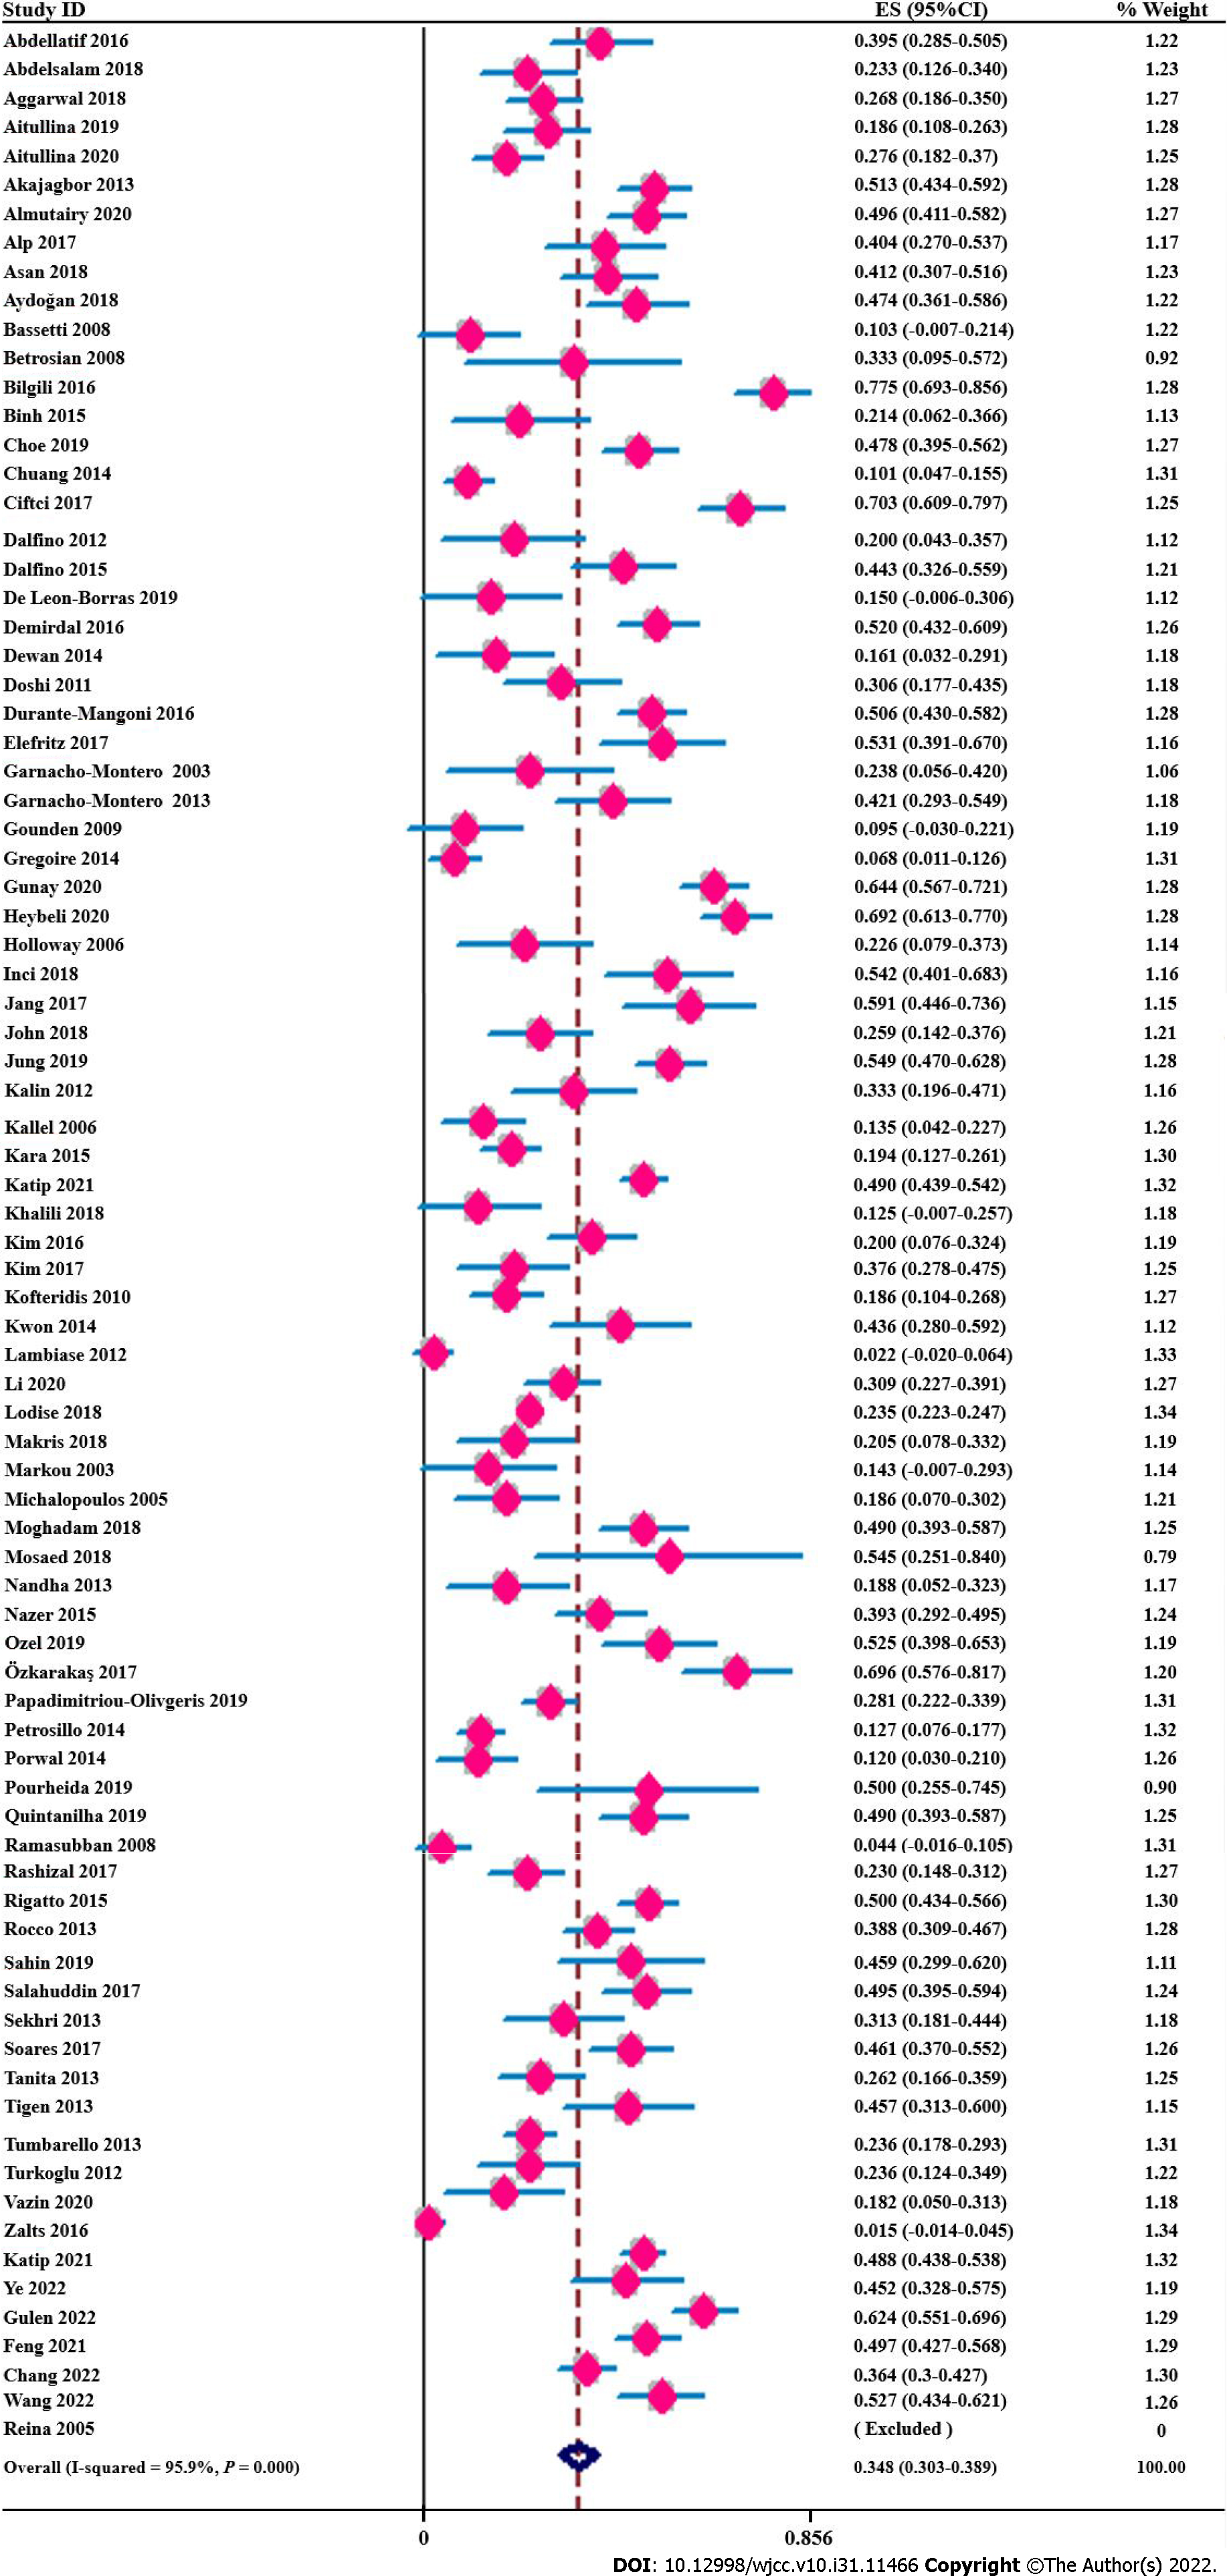
Figure 2 Forest plot portraying pooled incidence of polymyxin-induced nephrotoxicity.
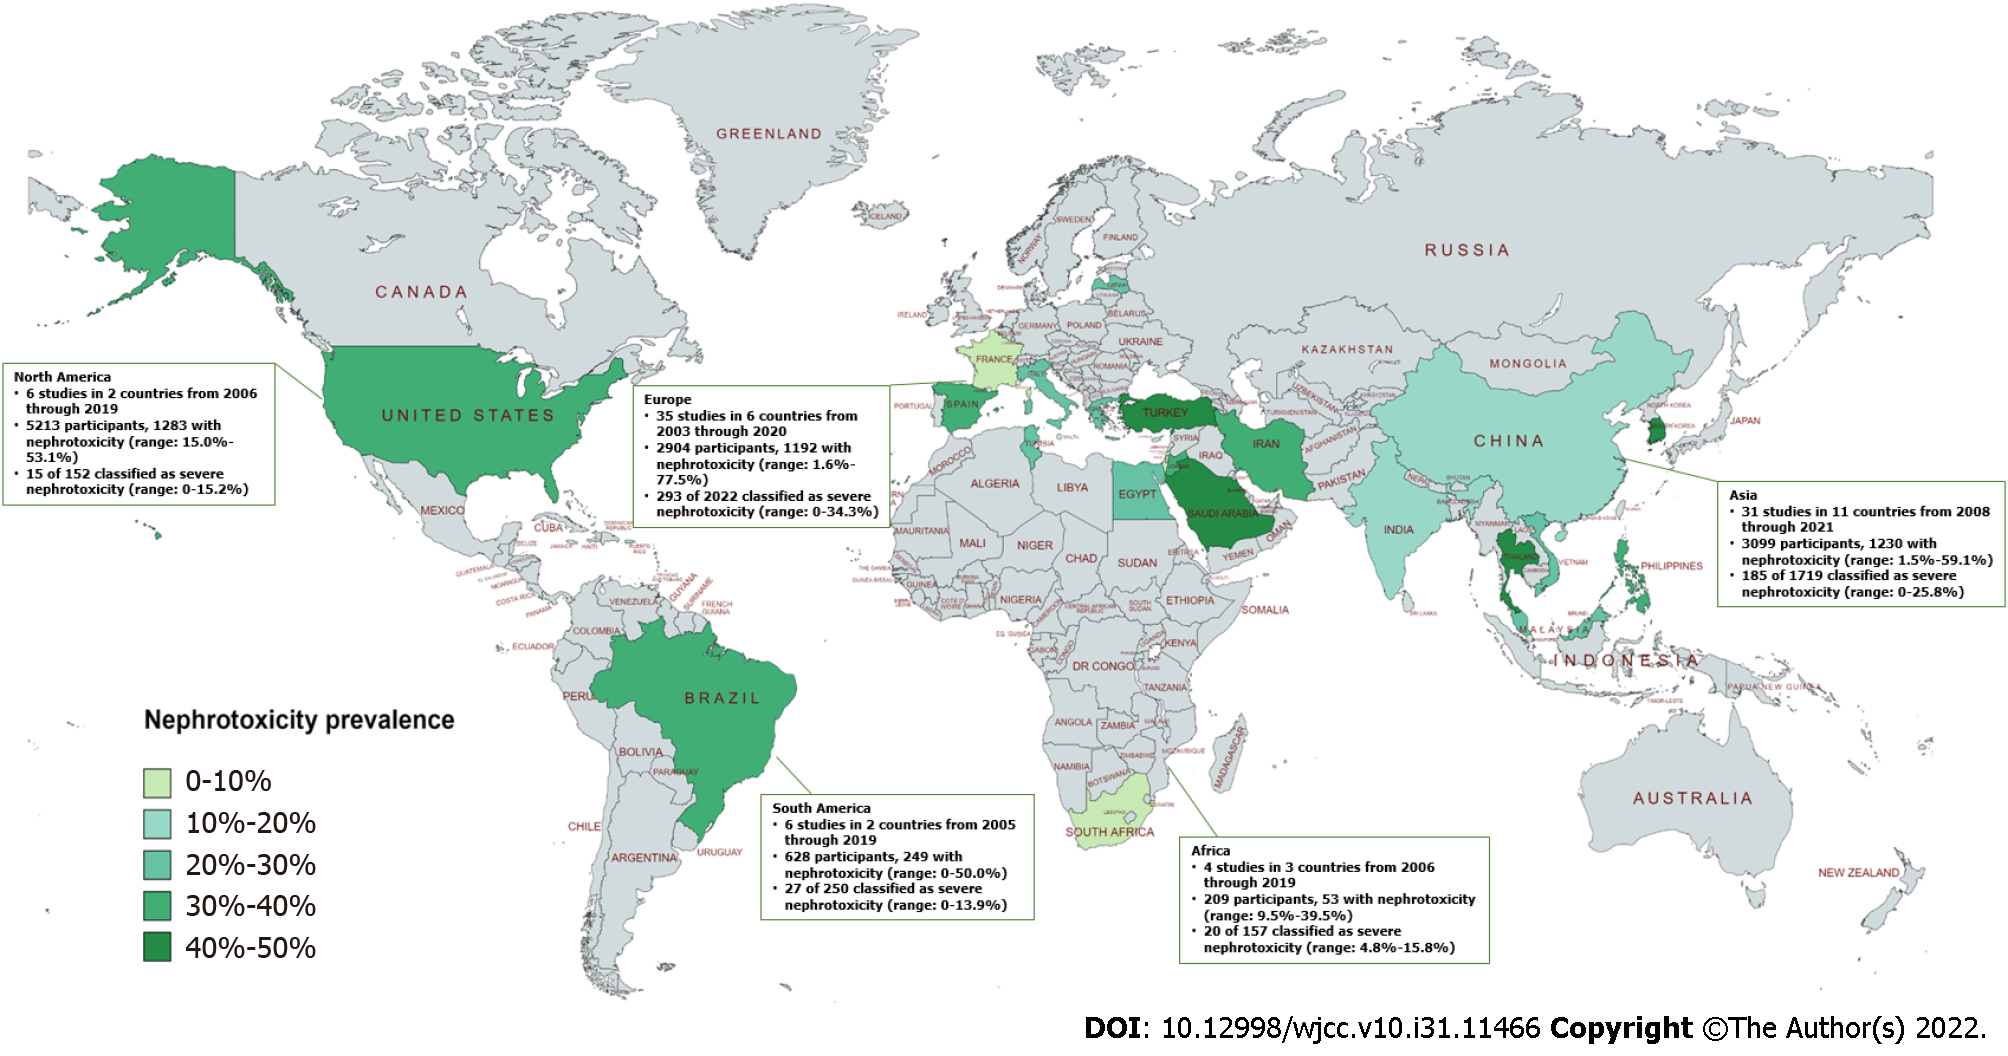
Figure 3 World map of nephrotoxicity prevalence.
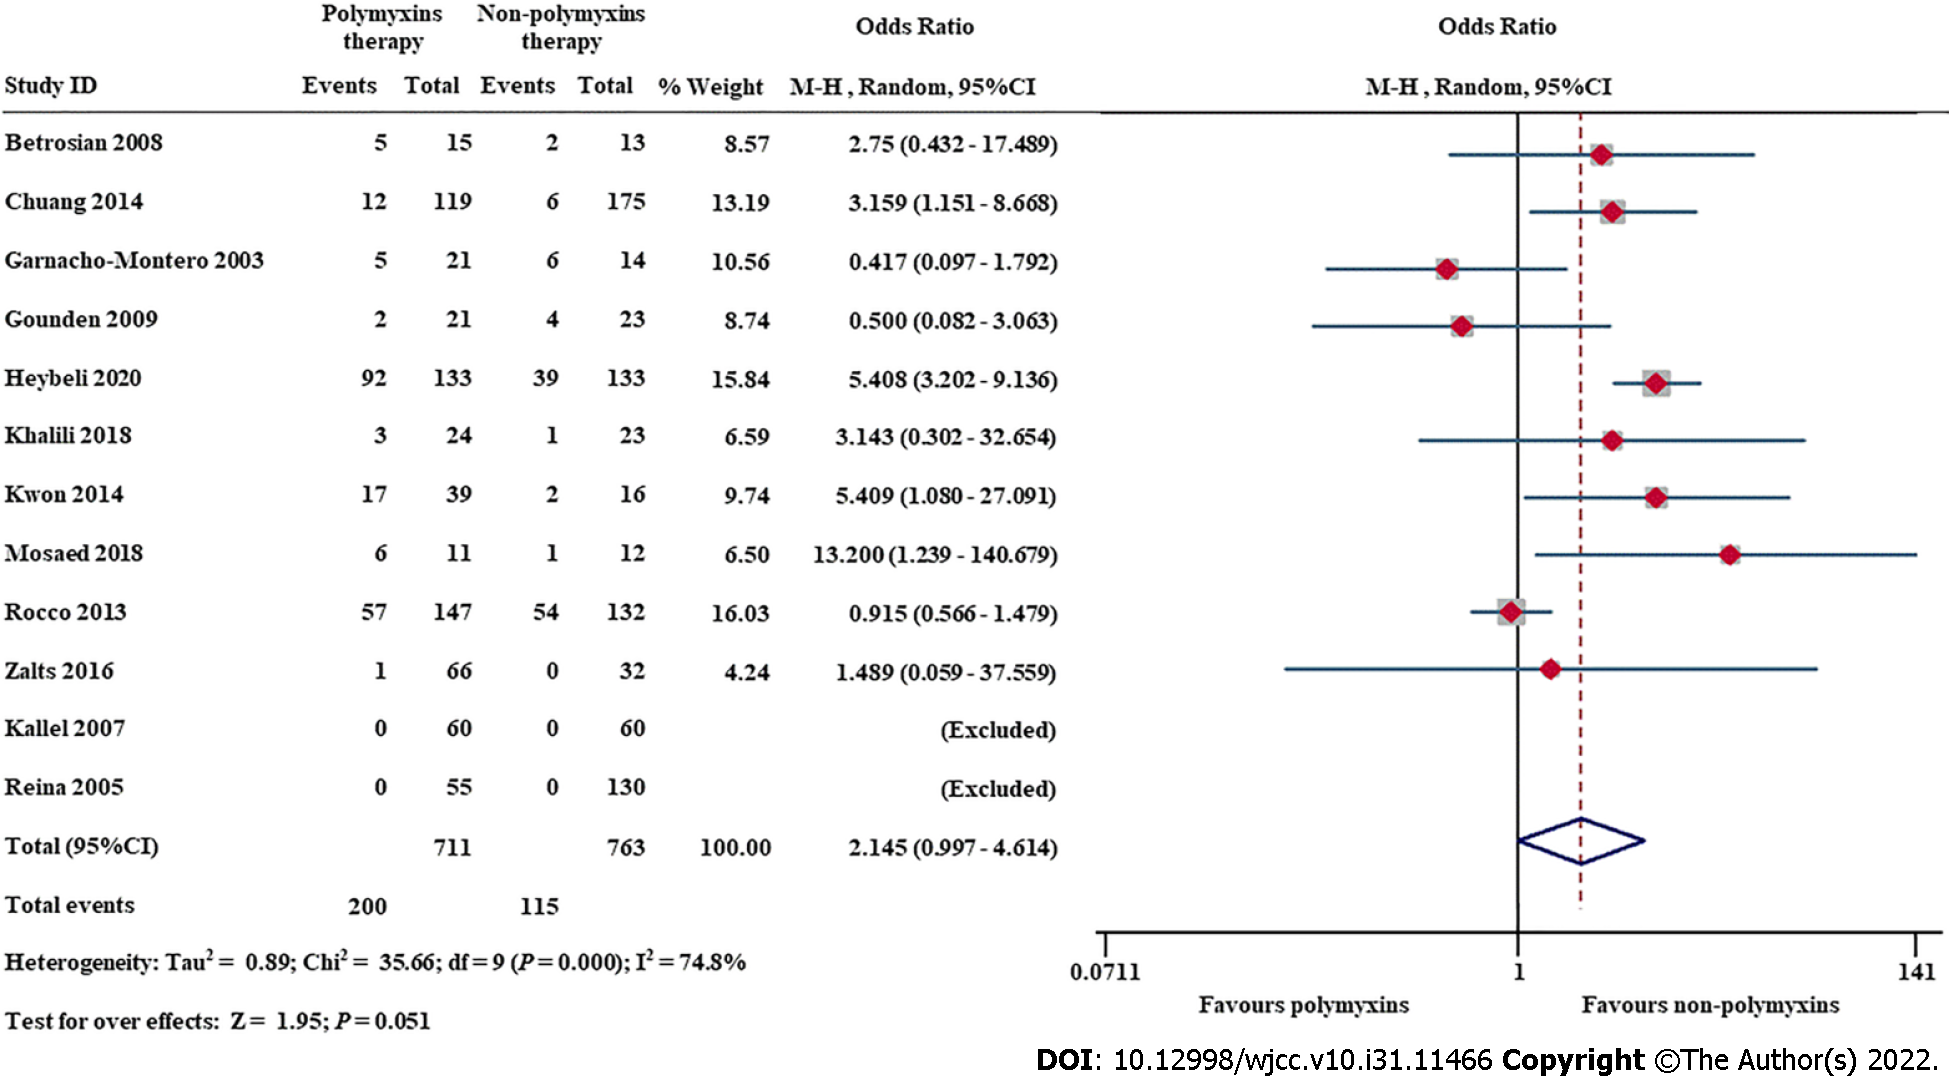
Figure 4 Forest plot of nephrotoxicity rates in patients receiving polymyxins compared to patients receiving other regimens.
- Citation: Wang JL, Xiang BX, Song XL, Que RM, Zuo XC, Xie YL. Prevalence of polymyxin-induced nephrotoxicity and its predictors in critically ill adult patients: A meta-analysis. World J Clin Cases 2022; 10(31): 11466-11485
- URL: https://www.wjgnet.com/2307-8960/full/v10/i31/11466.htm
- DOI: https://dx.doi.org/10.12998/wjcc.v10.i31.11466


