Copyright
©The Author(s) 2022.
World J Clin Cases. Nov 6, 2022; 10(31): 11371-11380
Published online Nov 6, 2022. doi: 10.12998/wjcc.v10.i31.11371
Published online Nov 6, 2022. doi: 10.12998/wjcc.v10.i31.11371
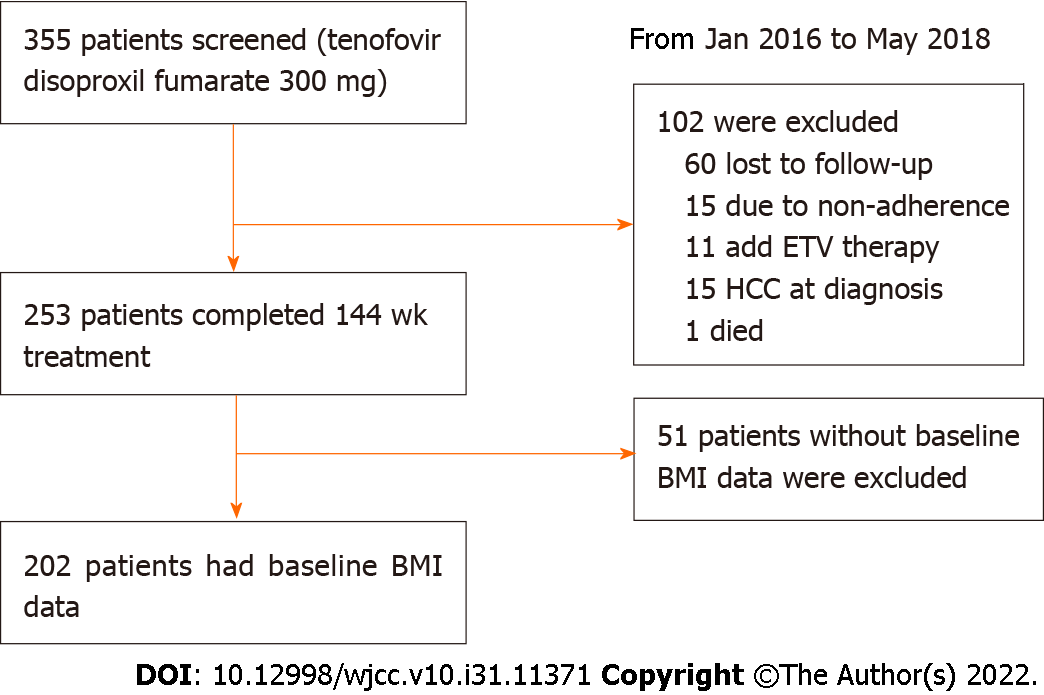
Figure 1 Flow chart of the study.
HCC: Hepatocellular carcinoma; ETV: Entecavir; BMI: Body mass index.
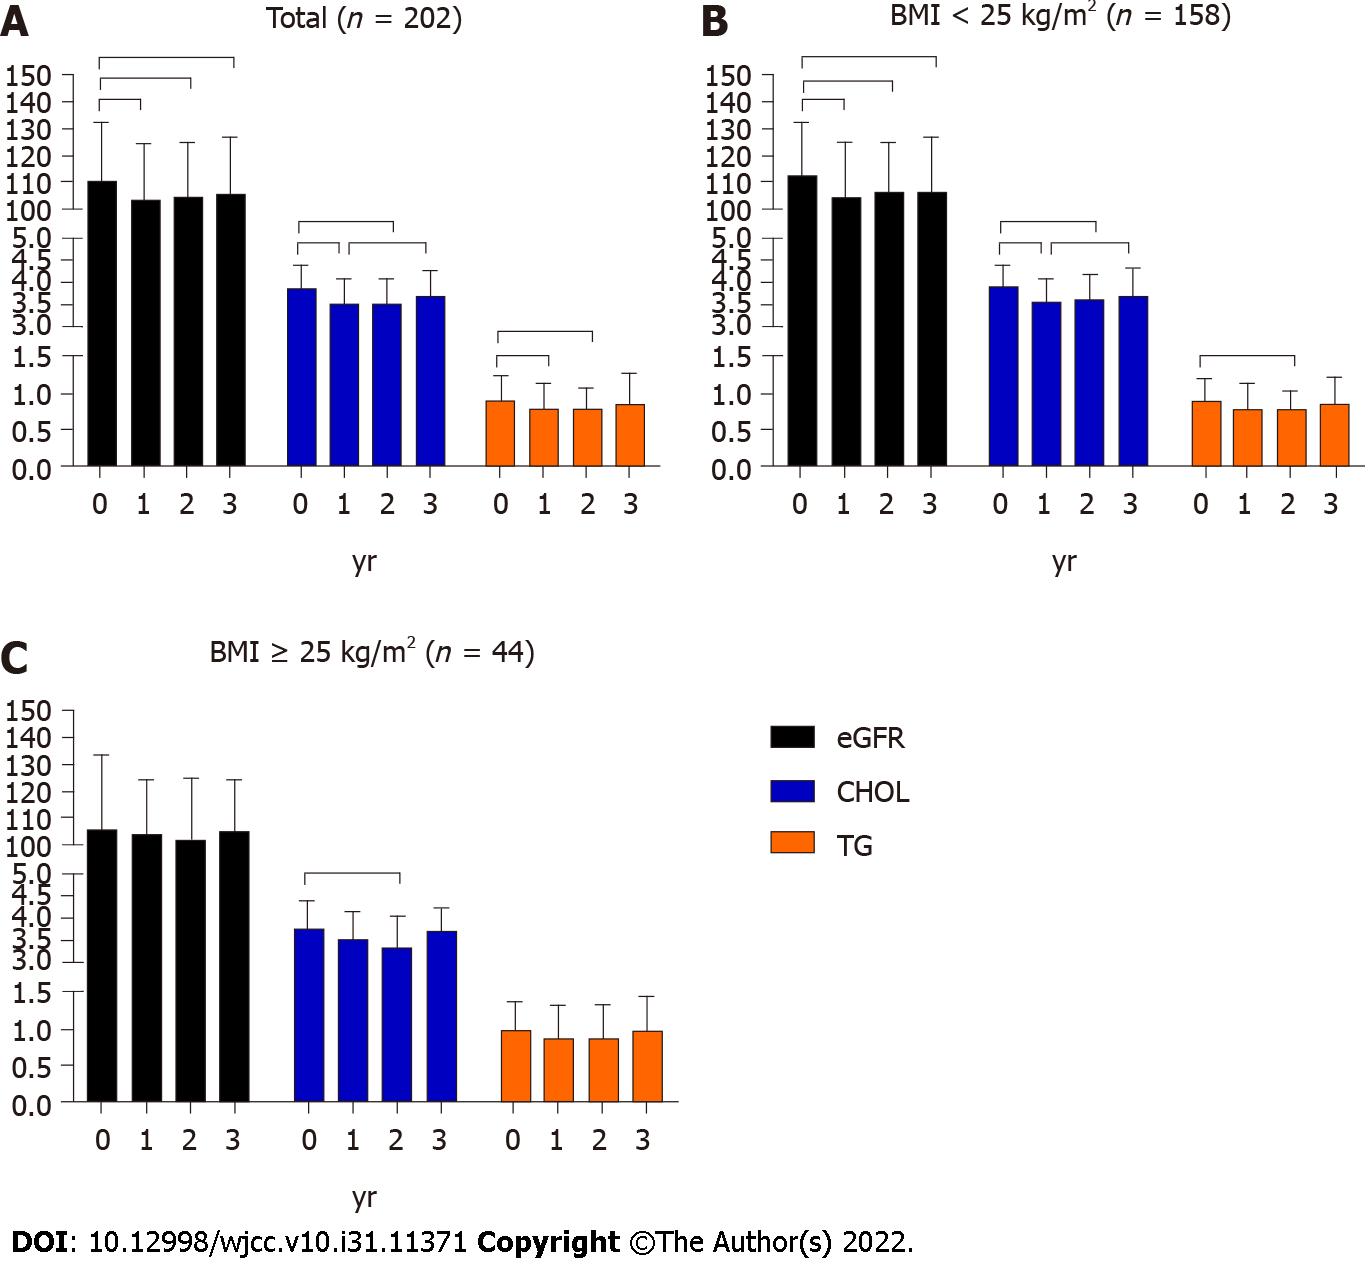
Figure 2 Dynamic changes in estimated glomerular filtration rate, CHOL, triglycerides during 3-year tenofovir disoproxil fumarate treatment.
A: Dynamic changes of estimated glomerular filtration rate (eGFR), cholesterol (CHOL), triglycerides (TG) in total population; B: Dynamic changes of eGFR, CHOL, TG in non-overweight population; C: Dynamic changes of eGFR, CHOL, TG in overweight population. BMI: Body mass index; eGFR: Estimated glomerular filtration rate; CHOL: Cholesterol; TG: Triglycerides.
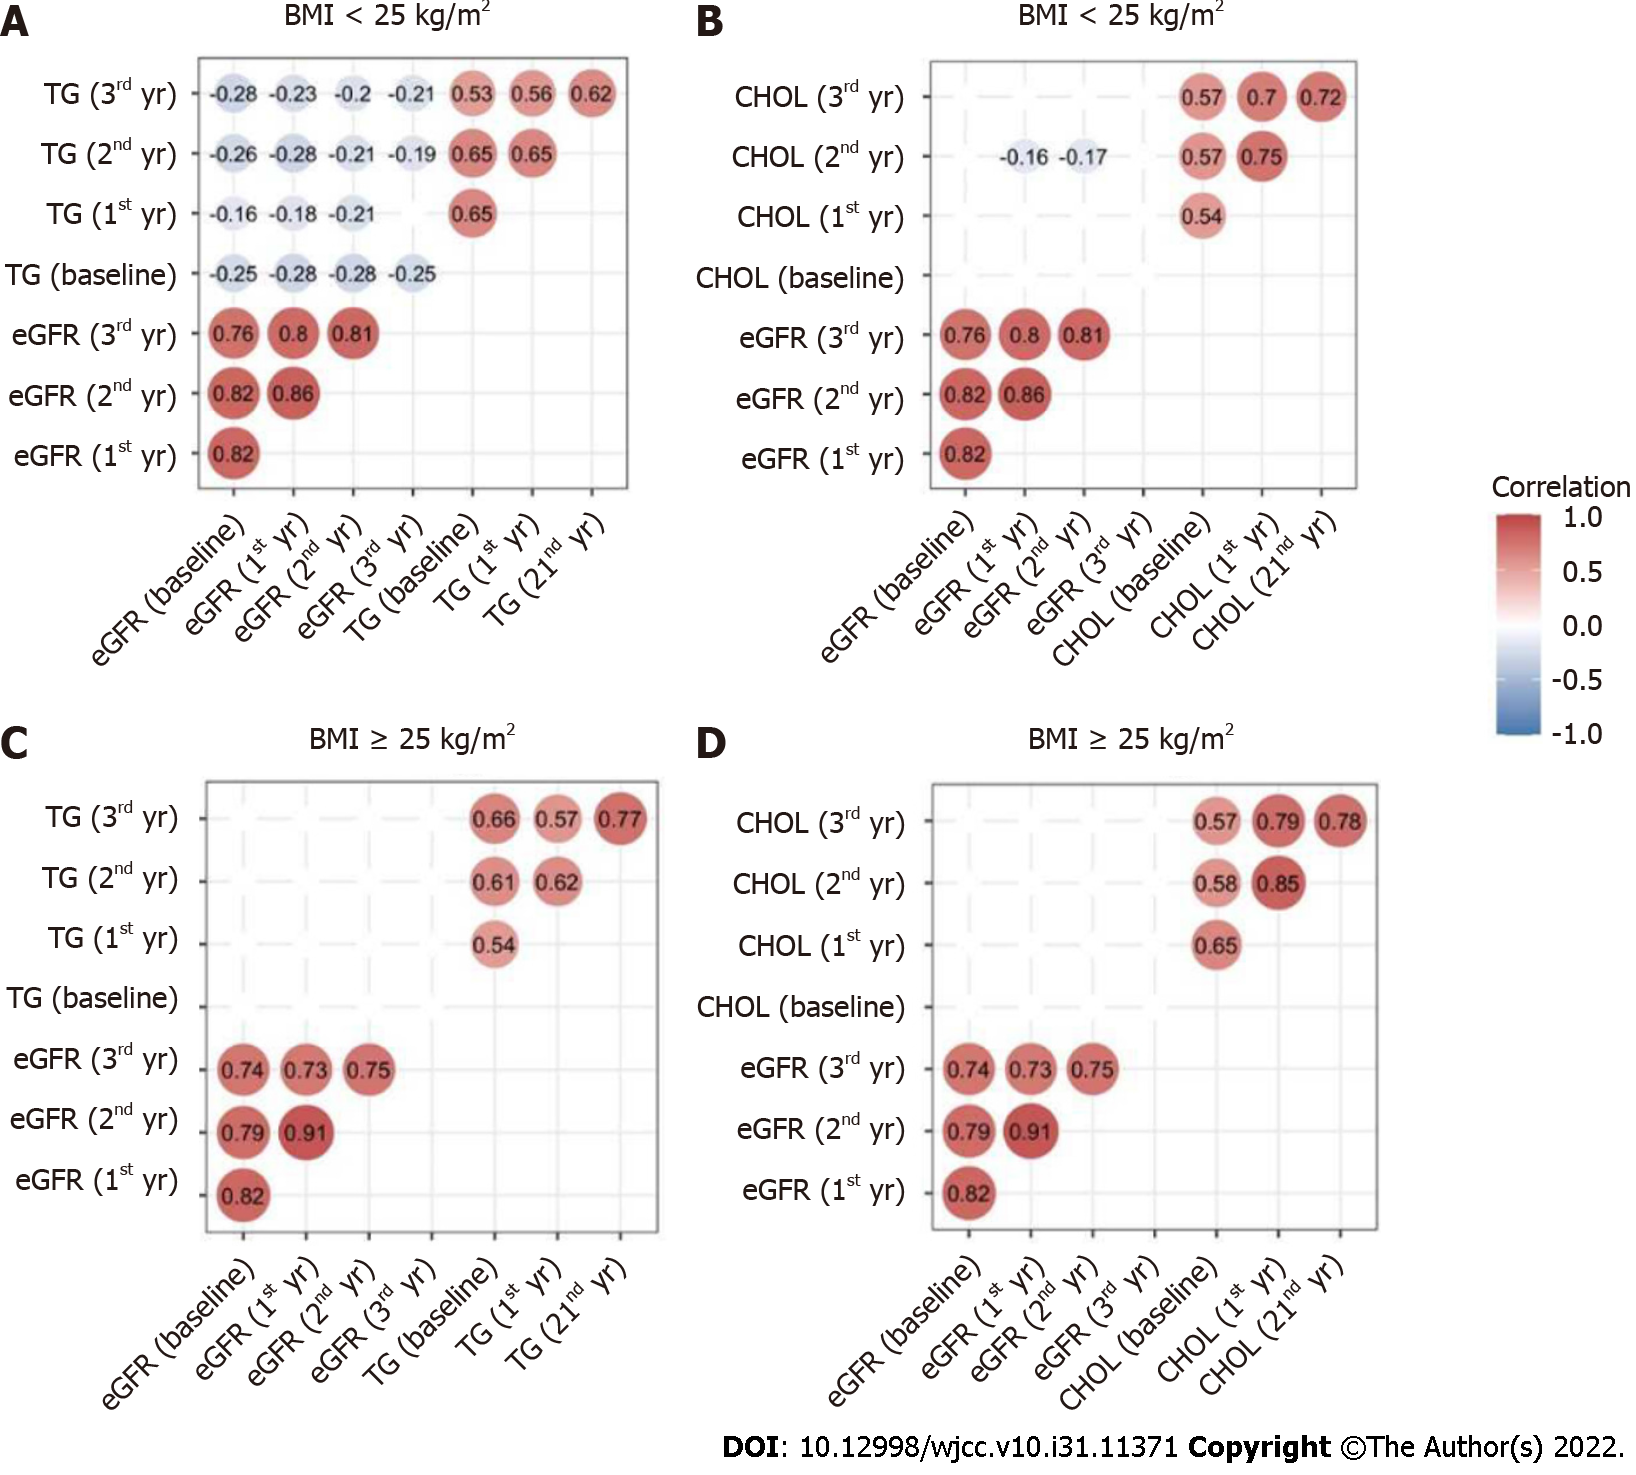
Figure 3 Correlation analysis between estimated glomerular filtration rate and lipid profiles.
A: Correlation between estimated glomerular filtration rate (eGFR) and triglycerides (TG) in non-overweight population; B: Correlation between eGFR and cholesterol (CHOL) in non-overweight population; C: Correlation between eGFR and TG in overweight population; D: Correlation between eGFR and CHOL in overweight population. BMI: Body mass index; TDF: Tenofovir disoproxil fumarate; eGFR: Estimated glomerular filtration rate; TG: Triglycerides; CHOL: Cholesterol.
- Citation: Liu SQ, Zhang XJ, Xue Y, Huang R, Wang J, Wu C, He YS, Pan YR, Liu LG. Dynamic changes of estimated glomerular filtration rate are conversely related to triglyceride in non-overweight patients . World J Clin Cases 2022; 10(31): 11371-11380
- URL: https://www.wjgnet.com/2307-8960/full/v10/i31/11371.htm
- DOI: https://dx.doi.org/10.12998/wjcc.v10.i31.11371


