Copyright
©The Author(s) 2022.
World J Clin Cases. Jul 16, 2022; 10(20): 6825-6844
Published online Jul 16, 2022. doi: 10.12998/wjcc.v10.i20.6825
Published online Jul 16, 2022. doi: 10.12998/wjcc.v10.i20.6825
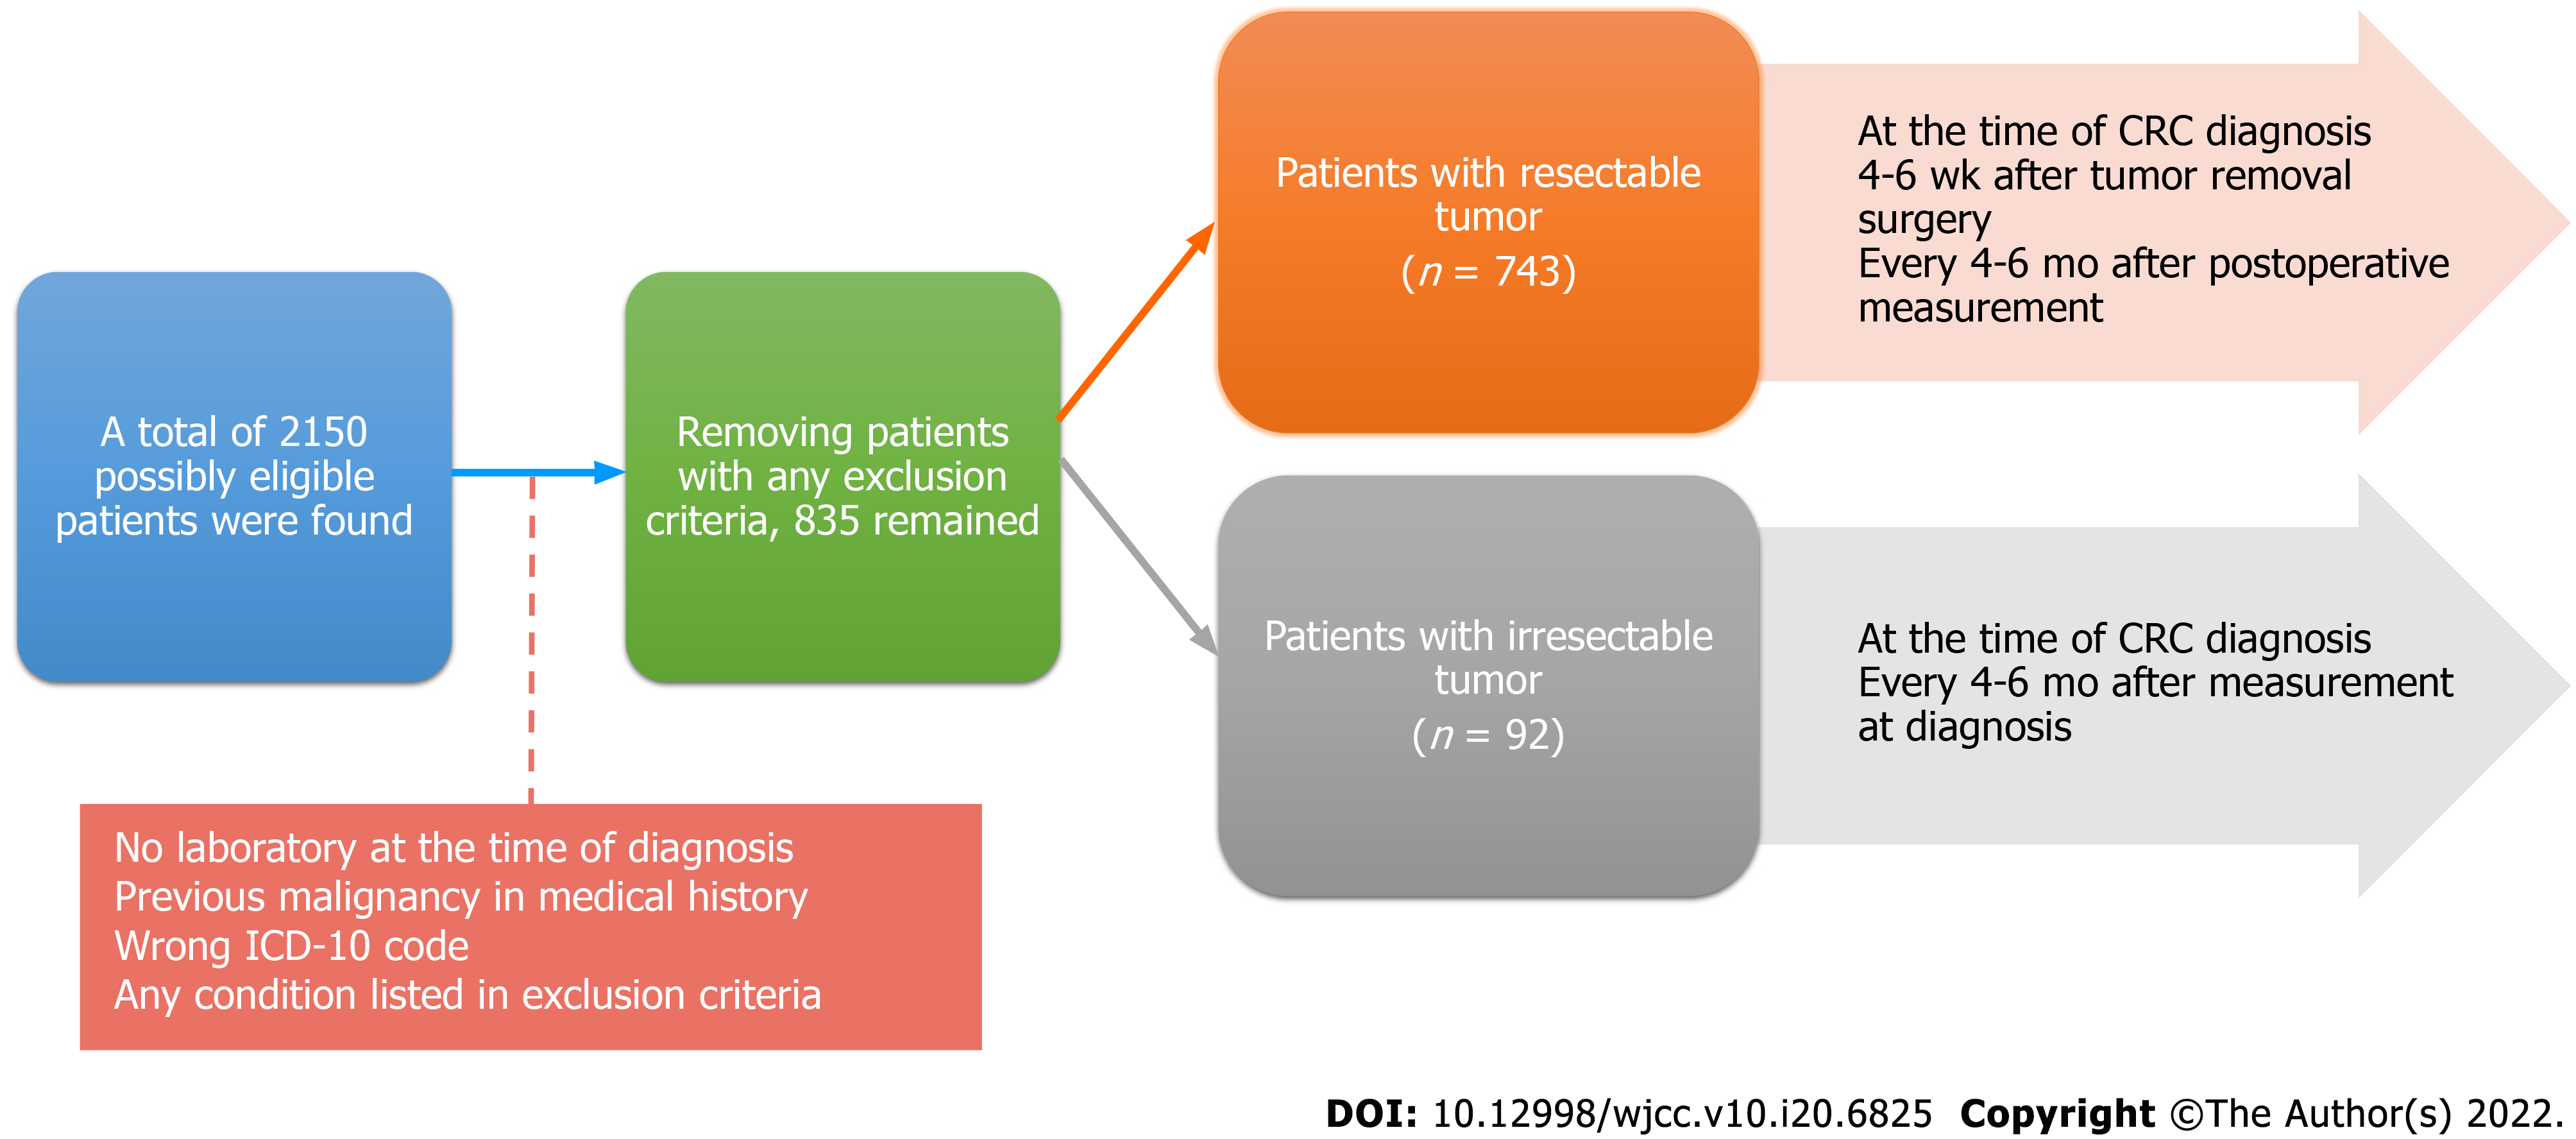
Figure 1 Schematic structure of the study.
ICD-10: International Statistical Classification of Diseases and Related Health Problems.
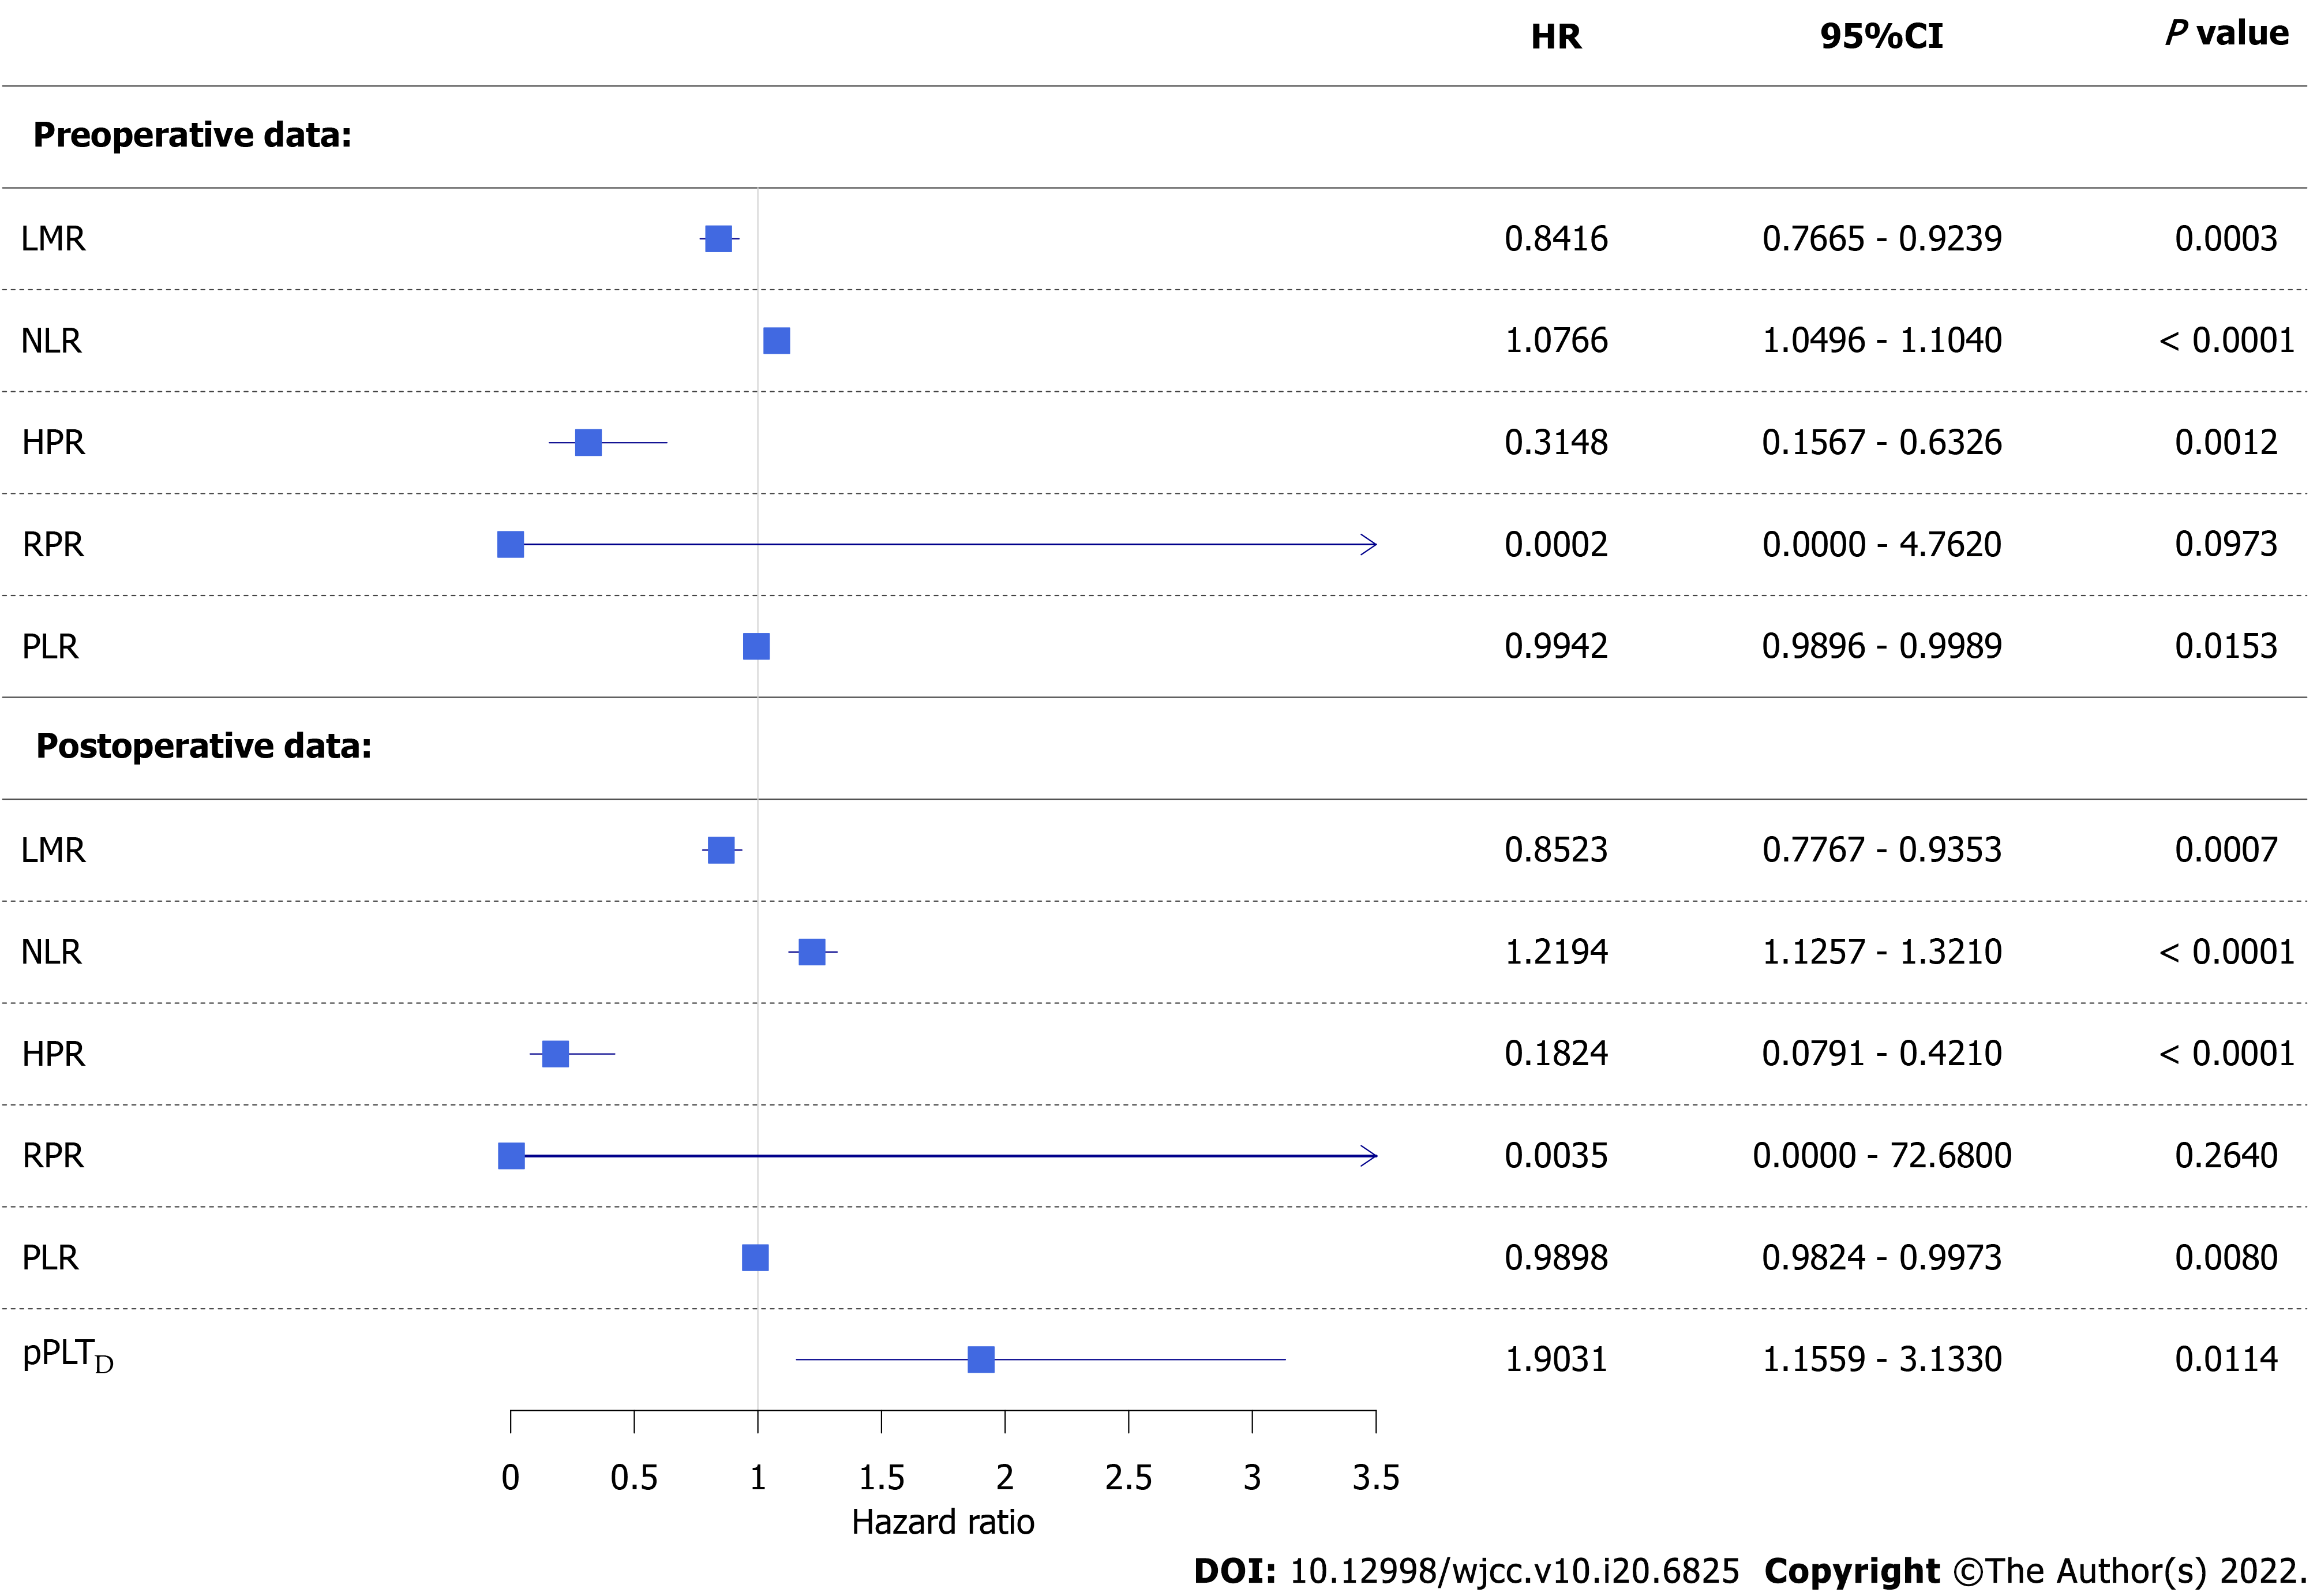
Figure 2 Forest plot of univariate competing risk survival models.
Colorectal cancer-specific hazard was higher if a patient had a lower lymphocyte-to-monocyte ratio, hemoglobin-to-platelet ratio, or platelet-to-lymphocyte ratio and higher neutrophil-to-lymphocyte ratio or personalized platelet count relative to “at-diagnosis”. Red blood cell distribution width-to-platelet ratio did not affect neither pre- nor post-operative survival. CI: Confidence interval; HR: Hazard ratio; LMR: Lymphocyte-to-monocyte ratio; PLR: Platelet-to-lymphocyte ratio; NLR: Neutrophil-to-lymphocyte ratio; HPR: hemoglobin-to-platelet ratio; RPR: red blood cell distribution width-to-platelet ratio; pPLTD: Personalized platelet count relative to “at-diagnosis”.
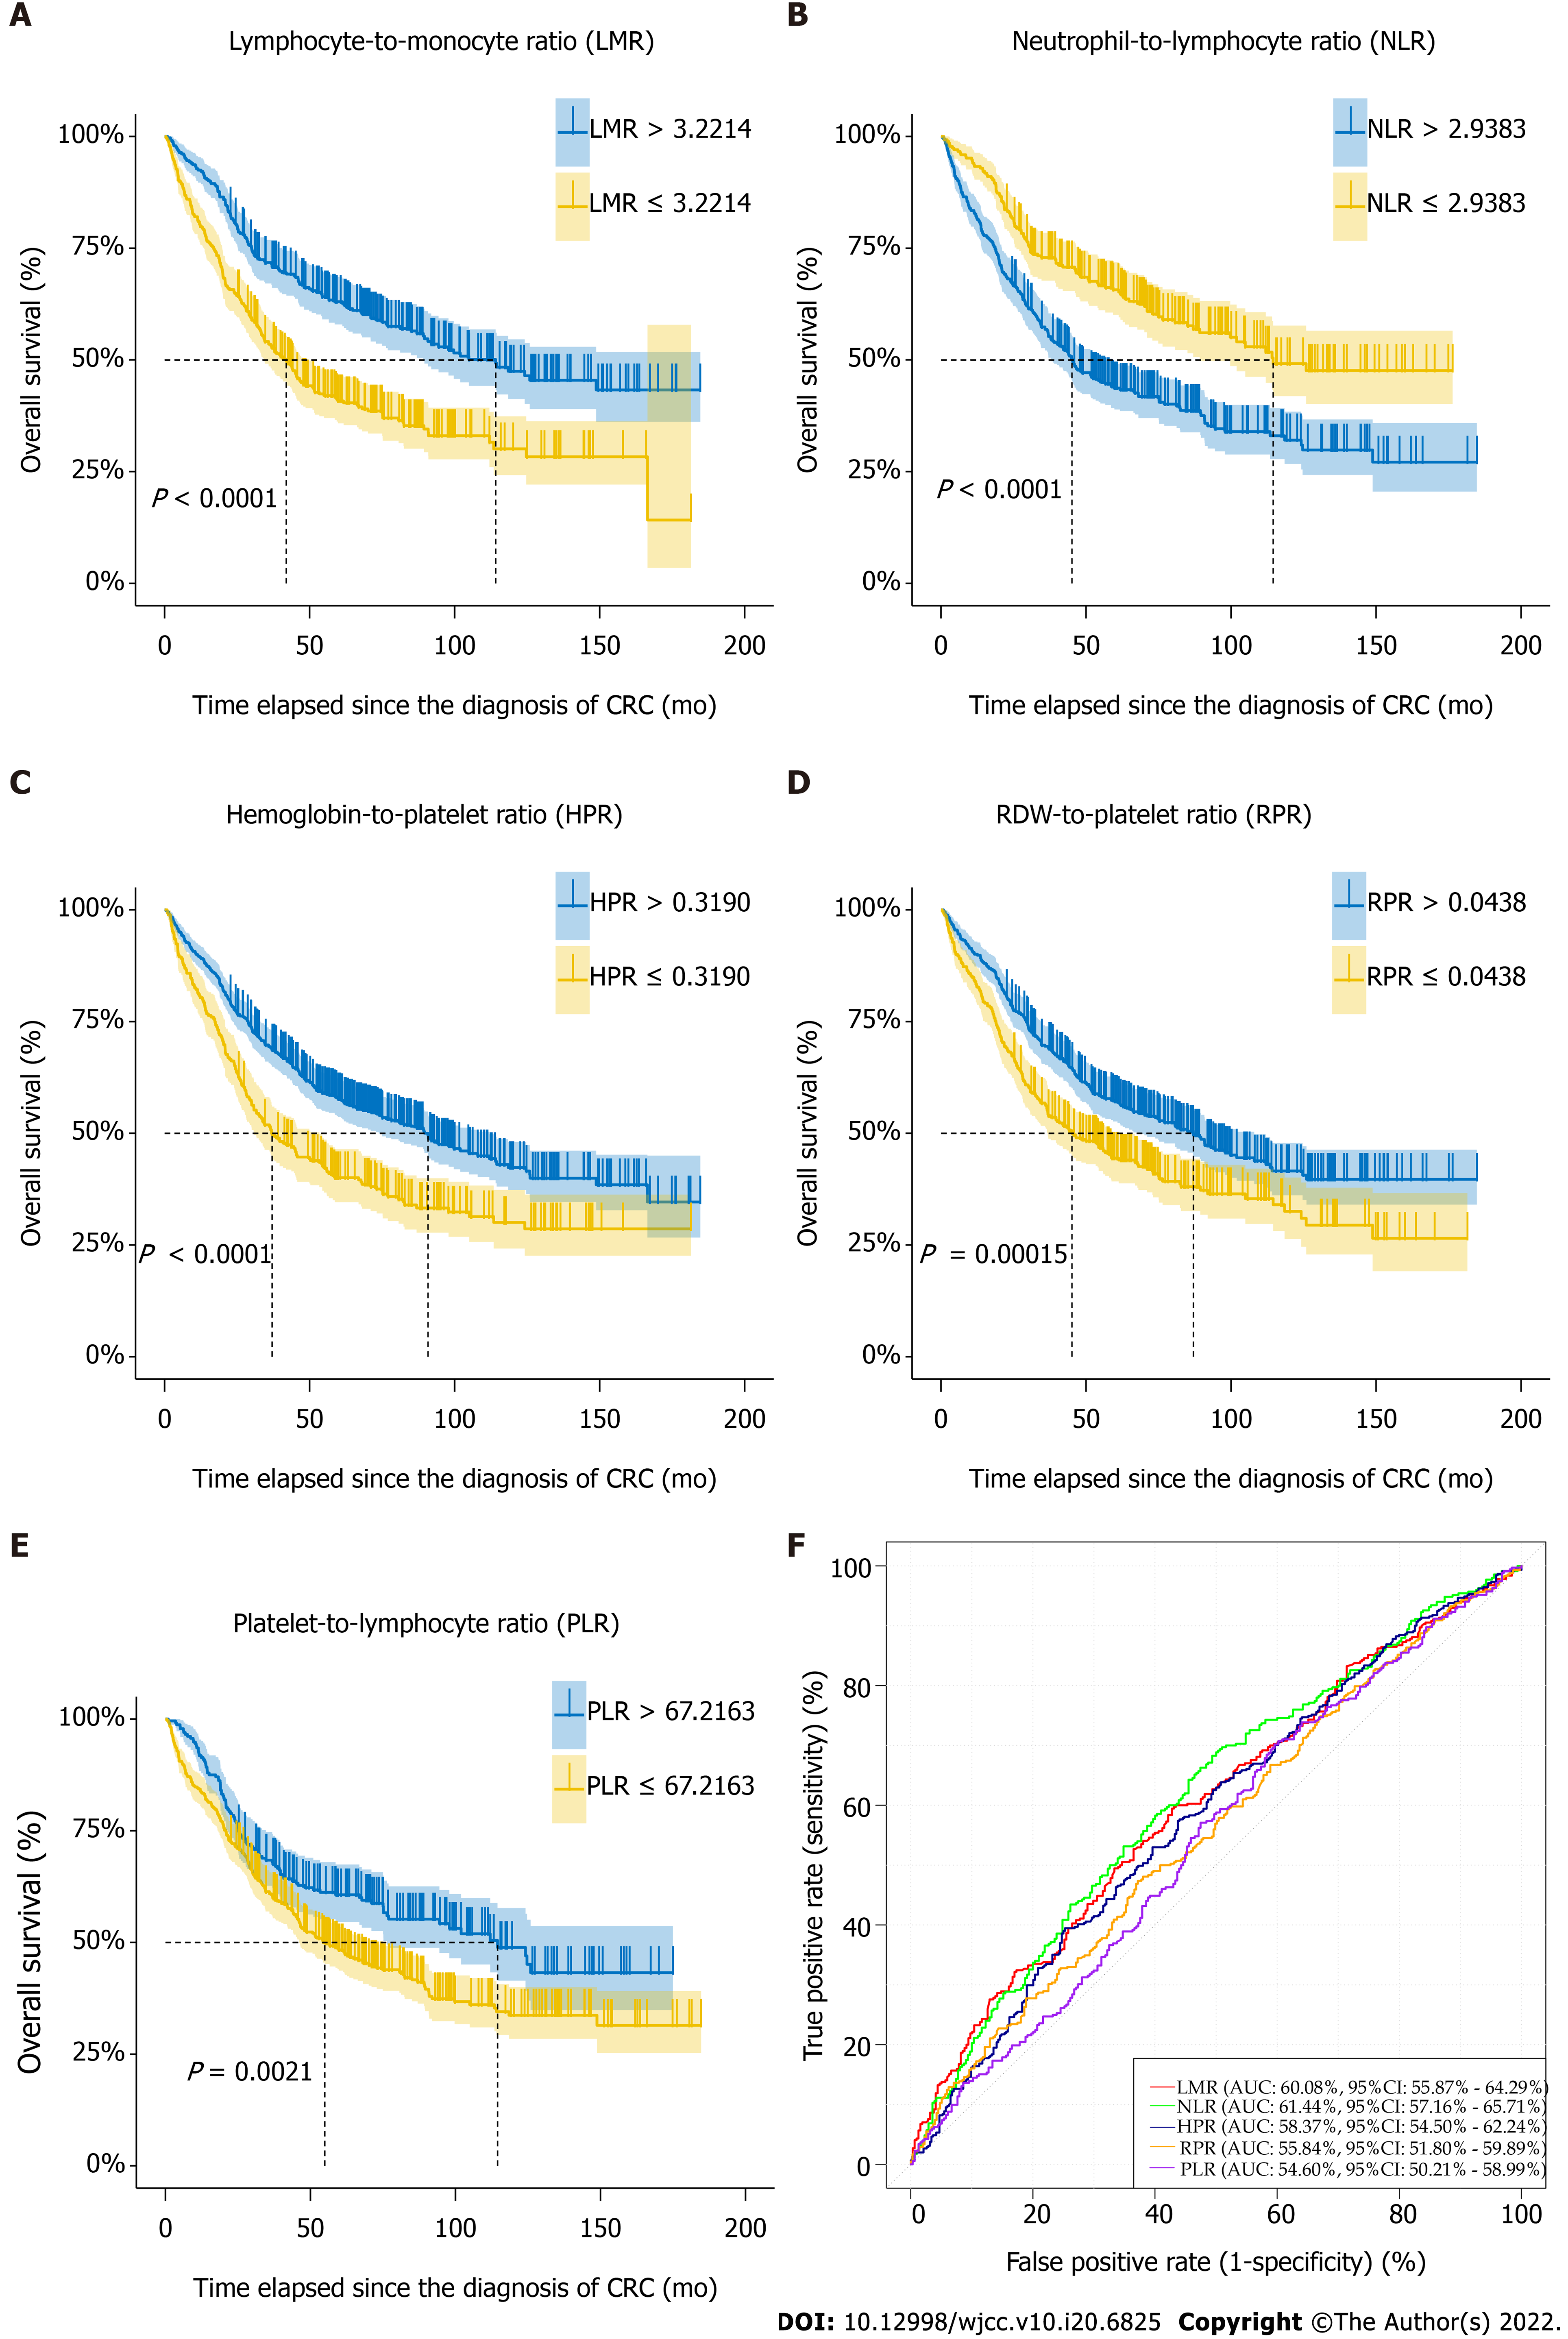
Figure 3 Naïve Kaplan-Meier survival curves of preoperative complete blood count ratios of colorectal cancer patients, which were dichotomized based on optimal thresholds available from receiver operating characteristic models.
AUC: Area under curve; CI: Confidence interval; RDW: Red blood cell distribution width.
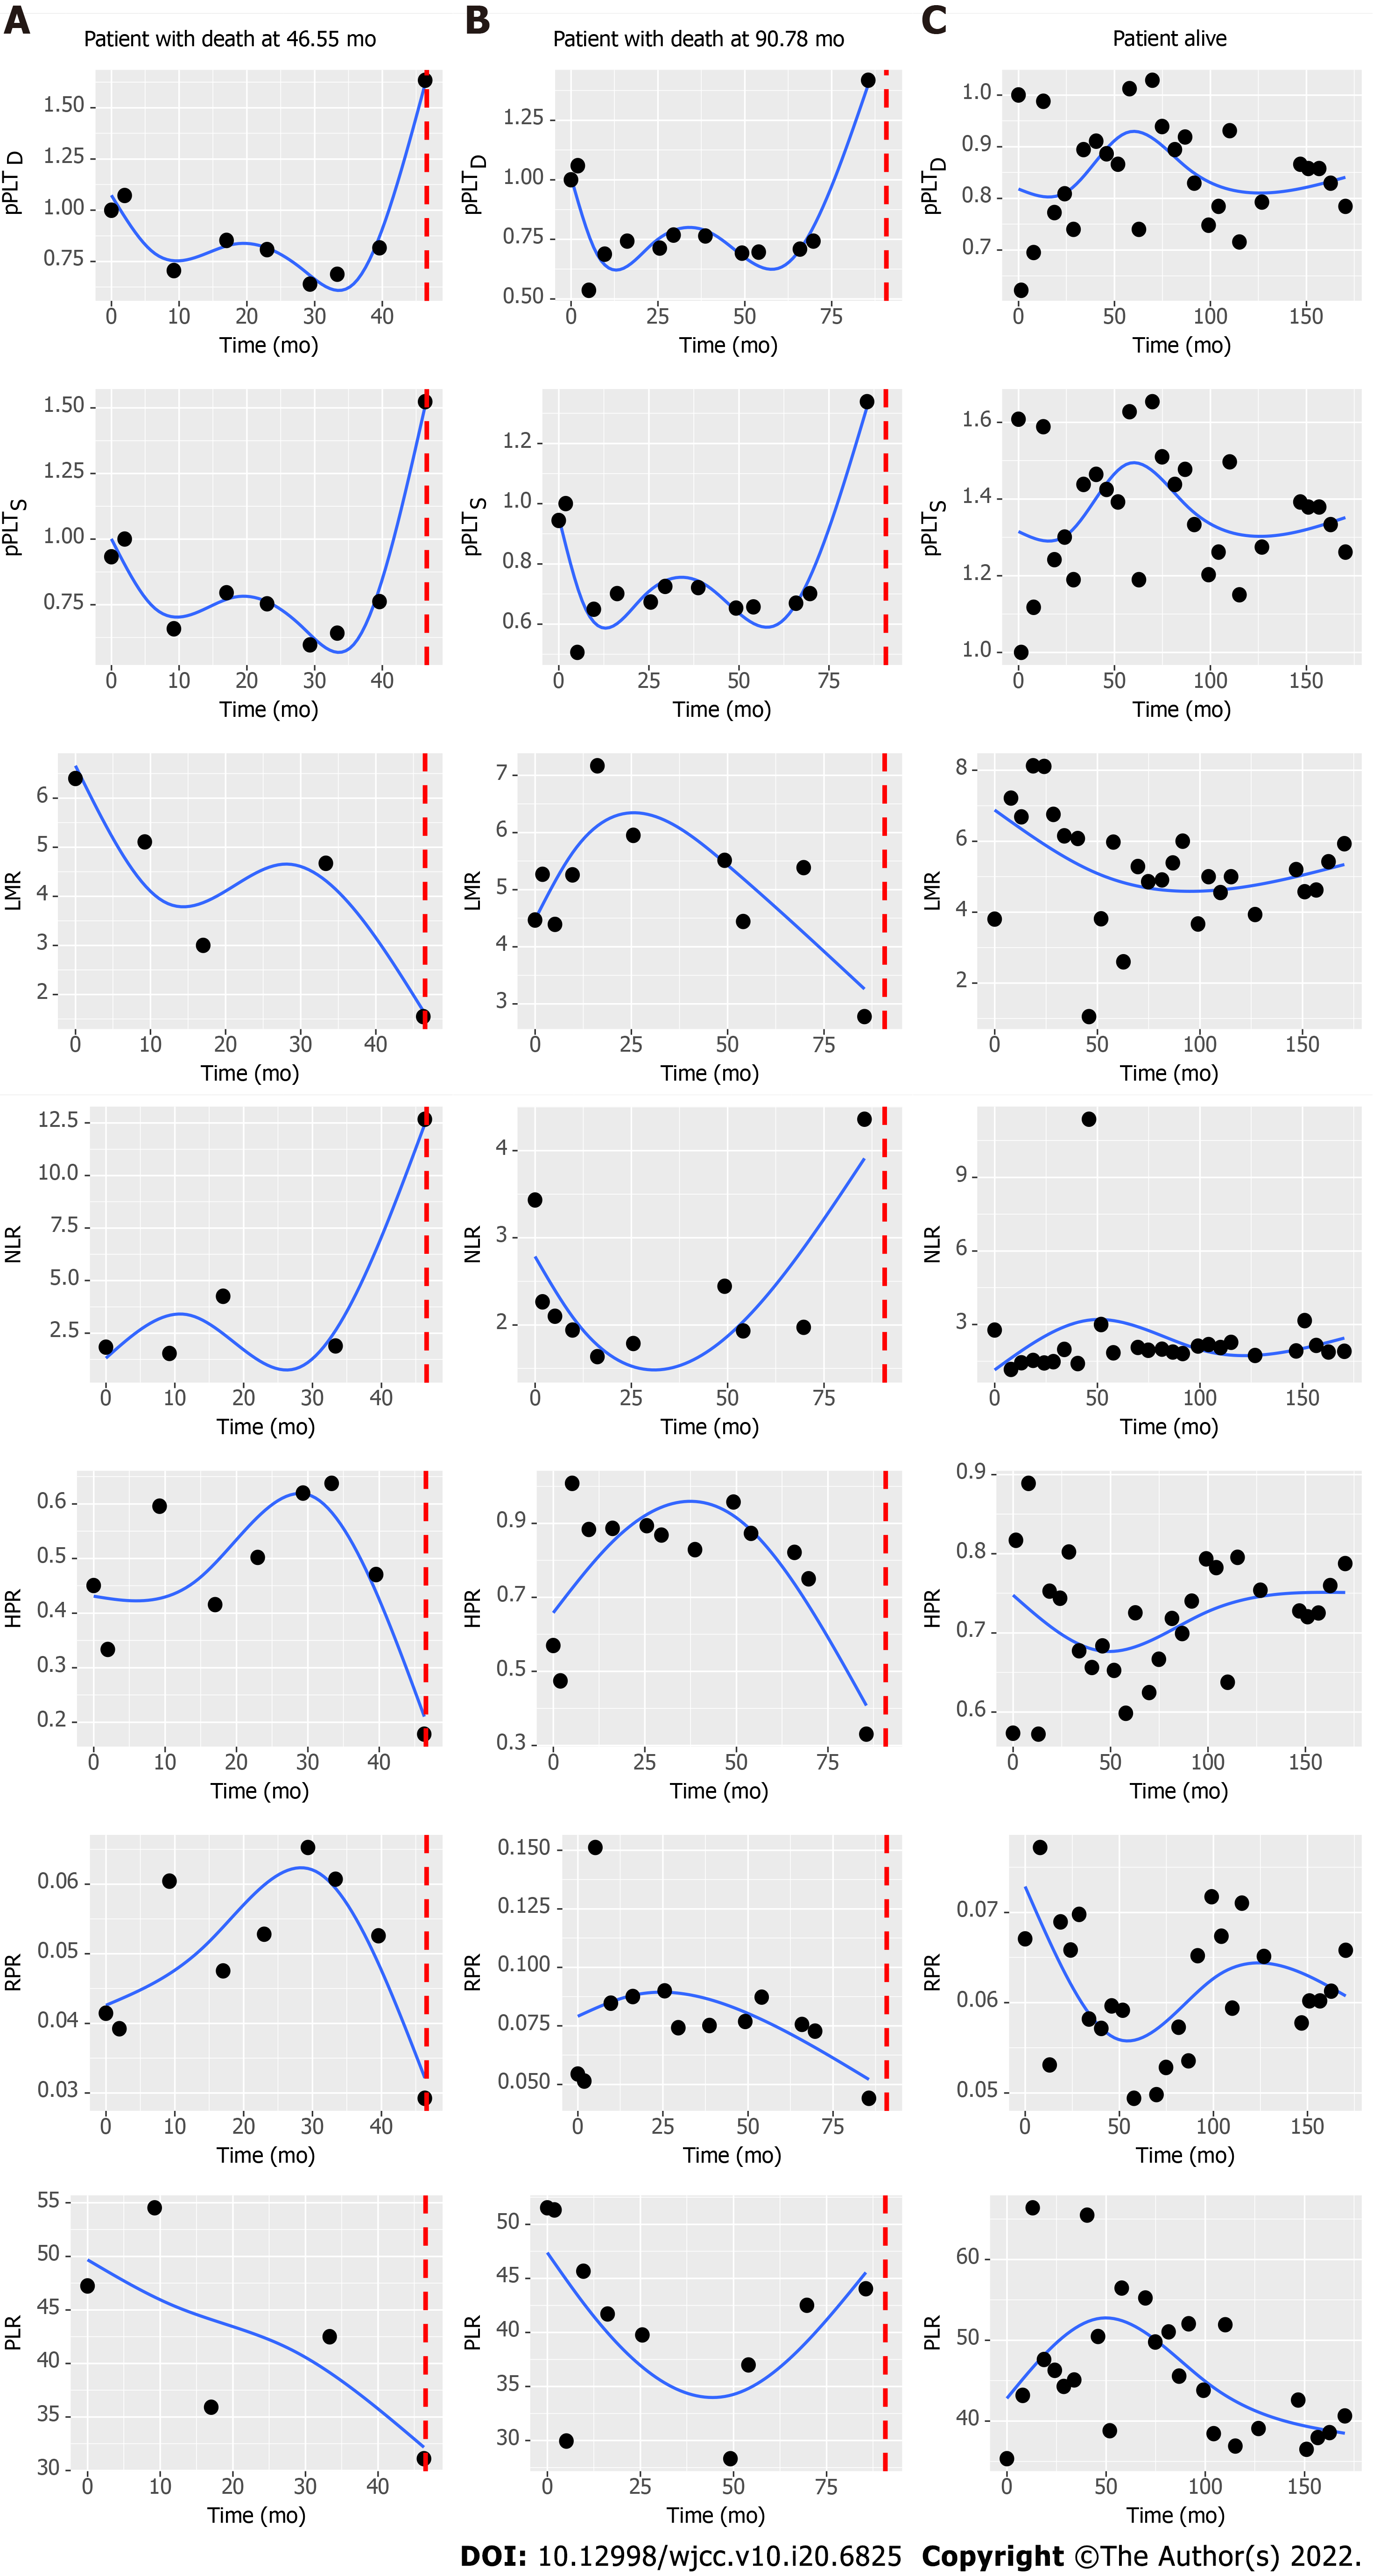
Figure 4 Characteristic changes of complete blood count ratios in patients who died or were alive at the end of our observation.
Dotted vertical line represents time of death. pPLTD: Personalized platelet count relative to “at-diagnosis”; pPLTS: Personalized platelet count relative to “after-surgery”; LMR: Lymphocyte-to-monocyte ratio; NLR: Neutrophil-to-lymphocyte ratio; HPR: Hemoglobin-to-platelet ratio; RPR: Red blood cell distribution width-to-platelet ratio; PLR: Platelet-to-lymphocyte ratio.
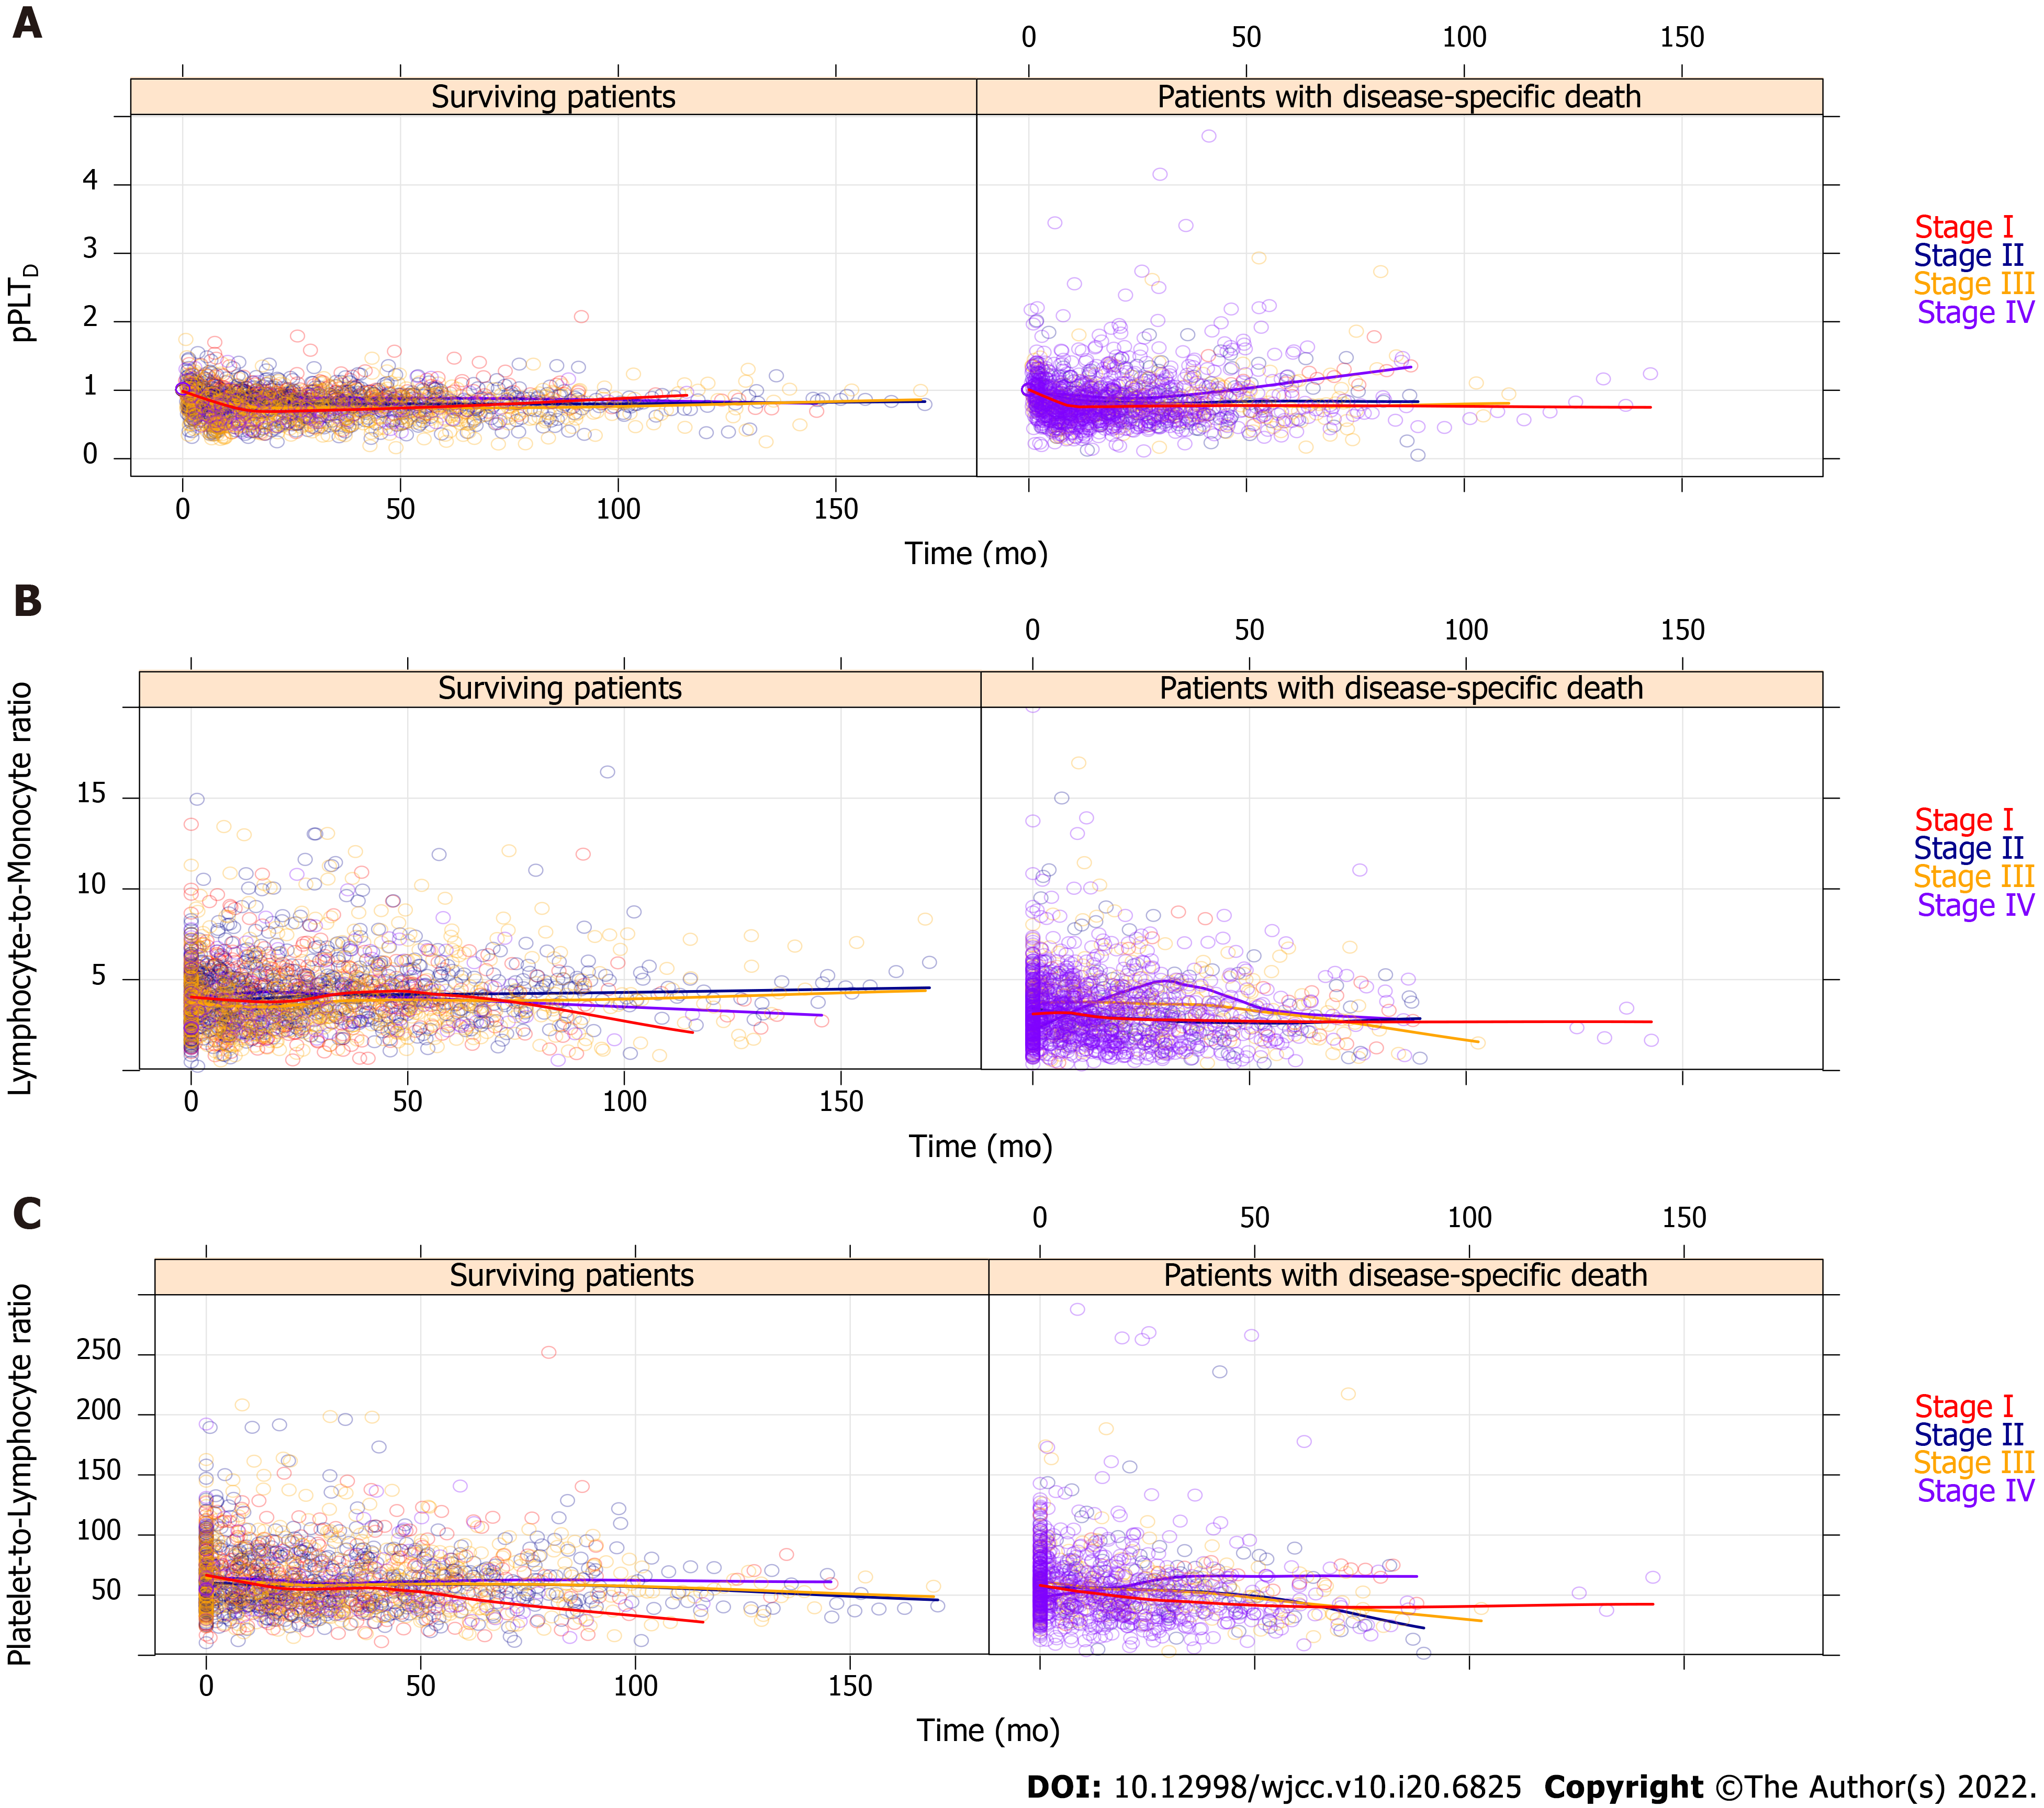
Figure 5 All recorded personalized platelet count relative to “at-diagnosis” (pPLTD), lymphocyte-to-monocyte ratio, and platelet-to-lymphocyte ratio values of the 835 study participants, which have been stratified by American Joint Committee on Cancer staging[21].
For better view, the remaining complete blood count ratios are drawn on Supplementary Figure 1. Regression curves are not drawn from the actual spline adjusted mixed effect model, but the automatic smoothing curve of the plotting process.
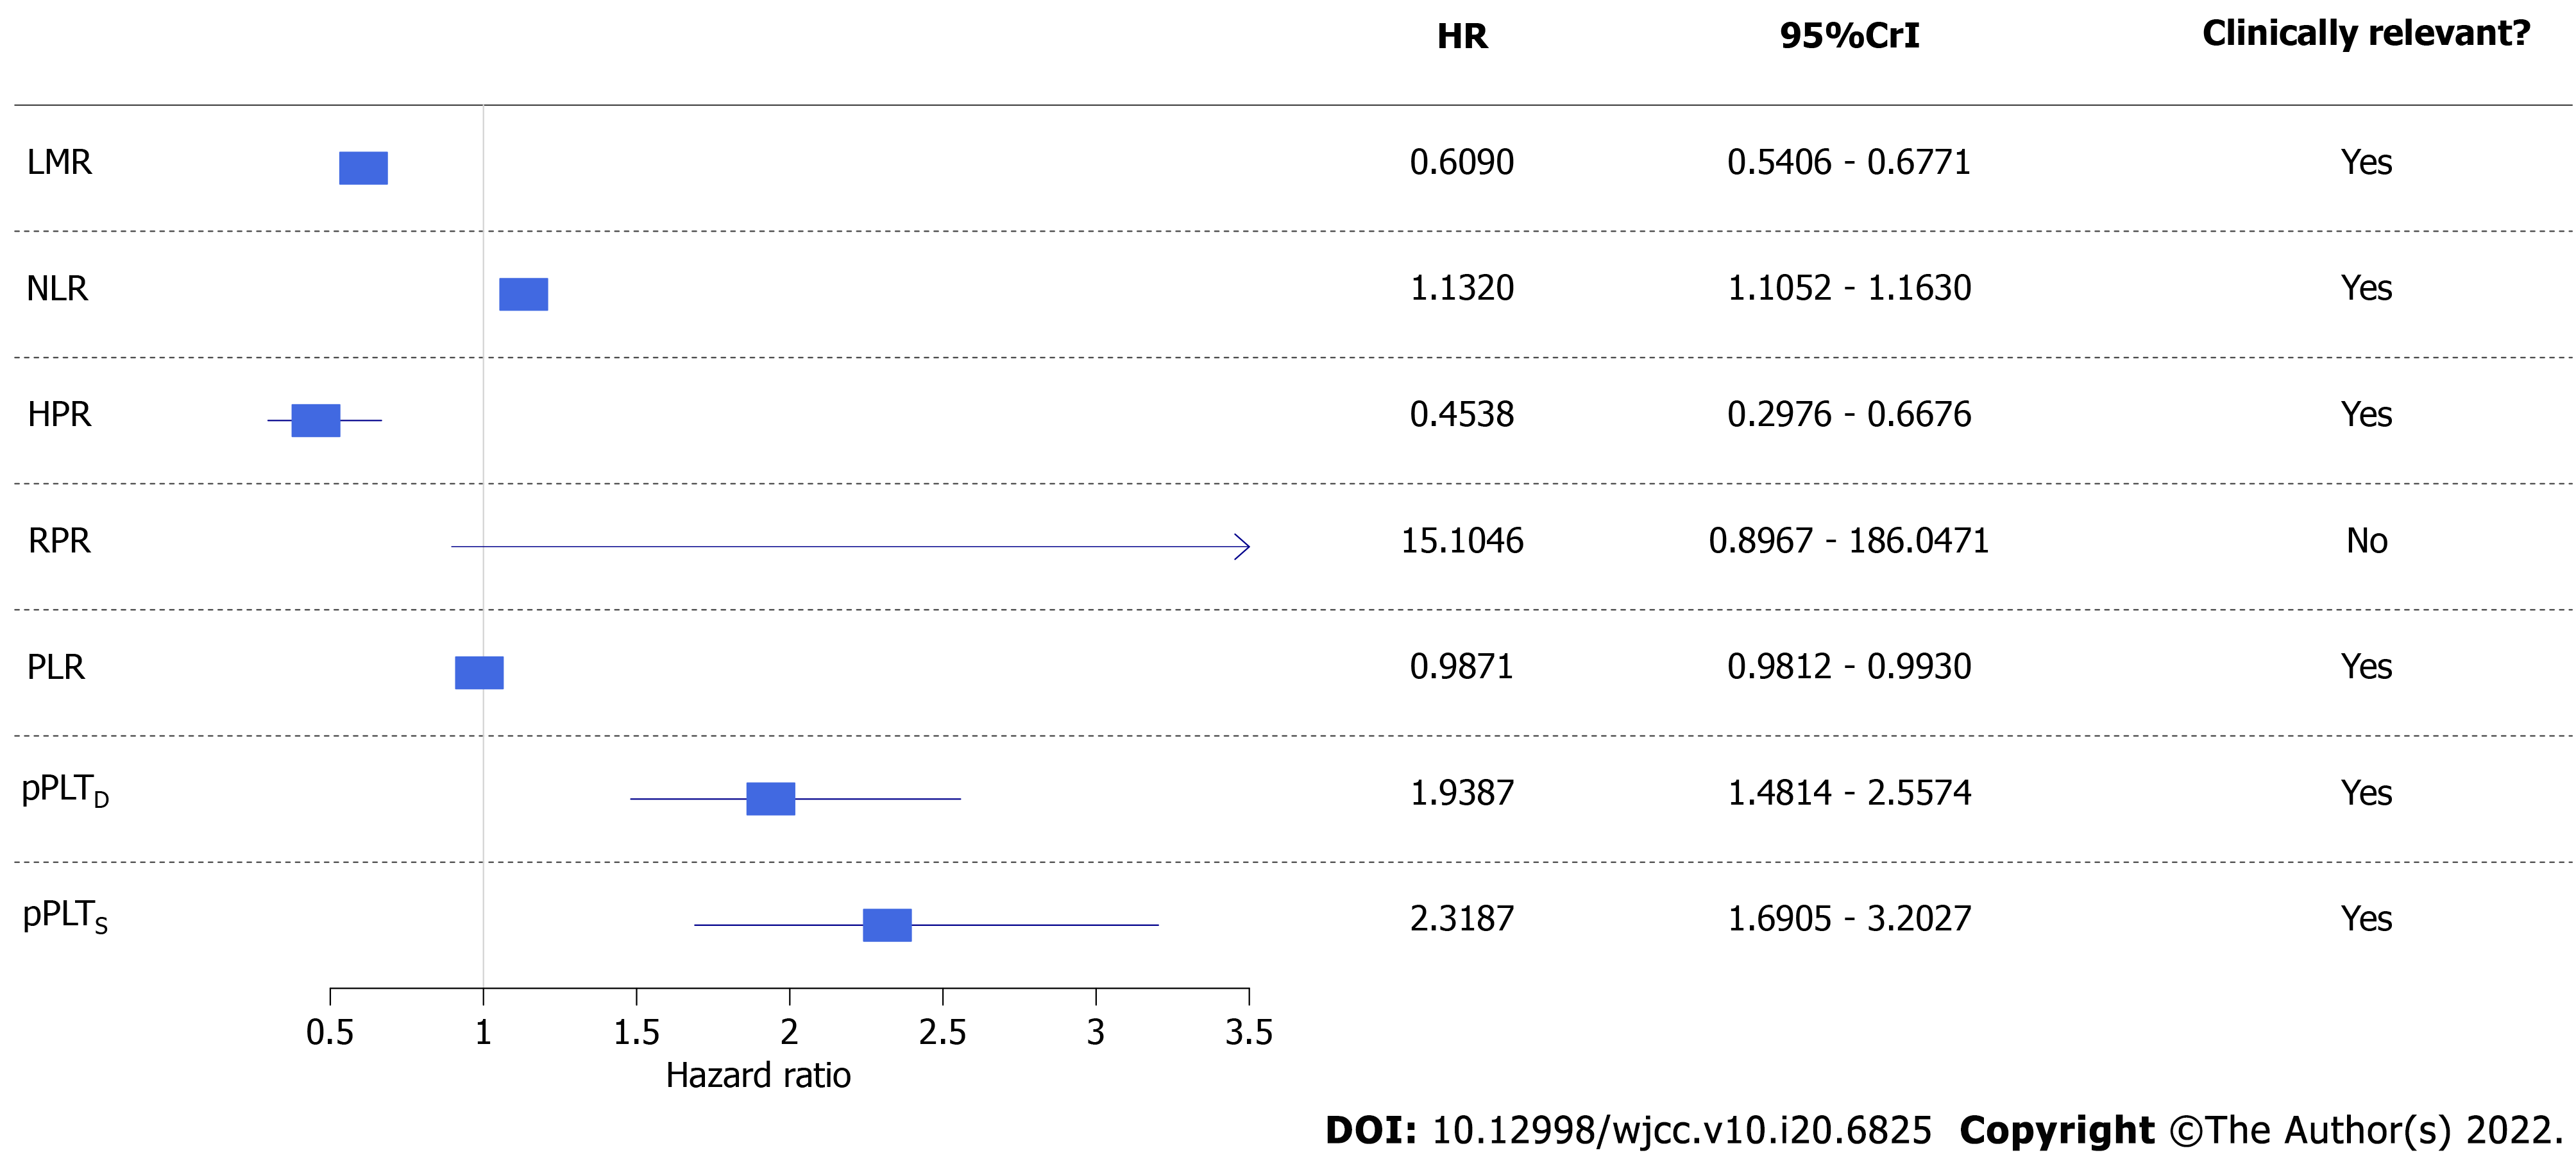
Figure 6 Forest plot of univariate Bayesian joint-models.
Higher risk of all-cause mortality was associated with a lower lymphocyte-to-monocyte ratio, hemoglobin-to-platelet ratio, and platelet-to-lymphocyte ratio and higher neutrophil-to-lymphocyte ratio, personalized platelet count relative to “at-diagnosis”, and personalized platelet count relative to “after-surgery”. Red blood cell distribution width-to-platelet ratio did not affect all-cause mortality of study participants. CrI: Credible interval; HR: Hazard ratio; LMR: Lymphocyte-to-monocyte ratio; PLR: Platelet-to-lymphocyte ratio; NLR: Neutrophil-to-lymphocyte ratio; HPR: hemoglobin-to-platelet ratio; RPR: red blood cell distribution width-to-platelet ratio; pPLTD: Personalized platelet count relative to “at-diagnosis”; pPLTS: Personalized platelet count relative to “after-surgery”. Bayesian statistical methods do not give P values, and evaluation of results was detailed in methods.
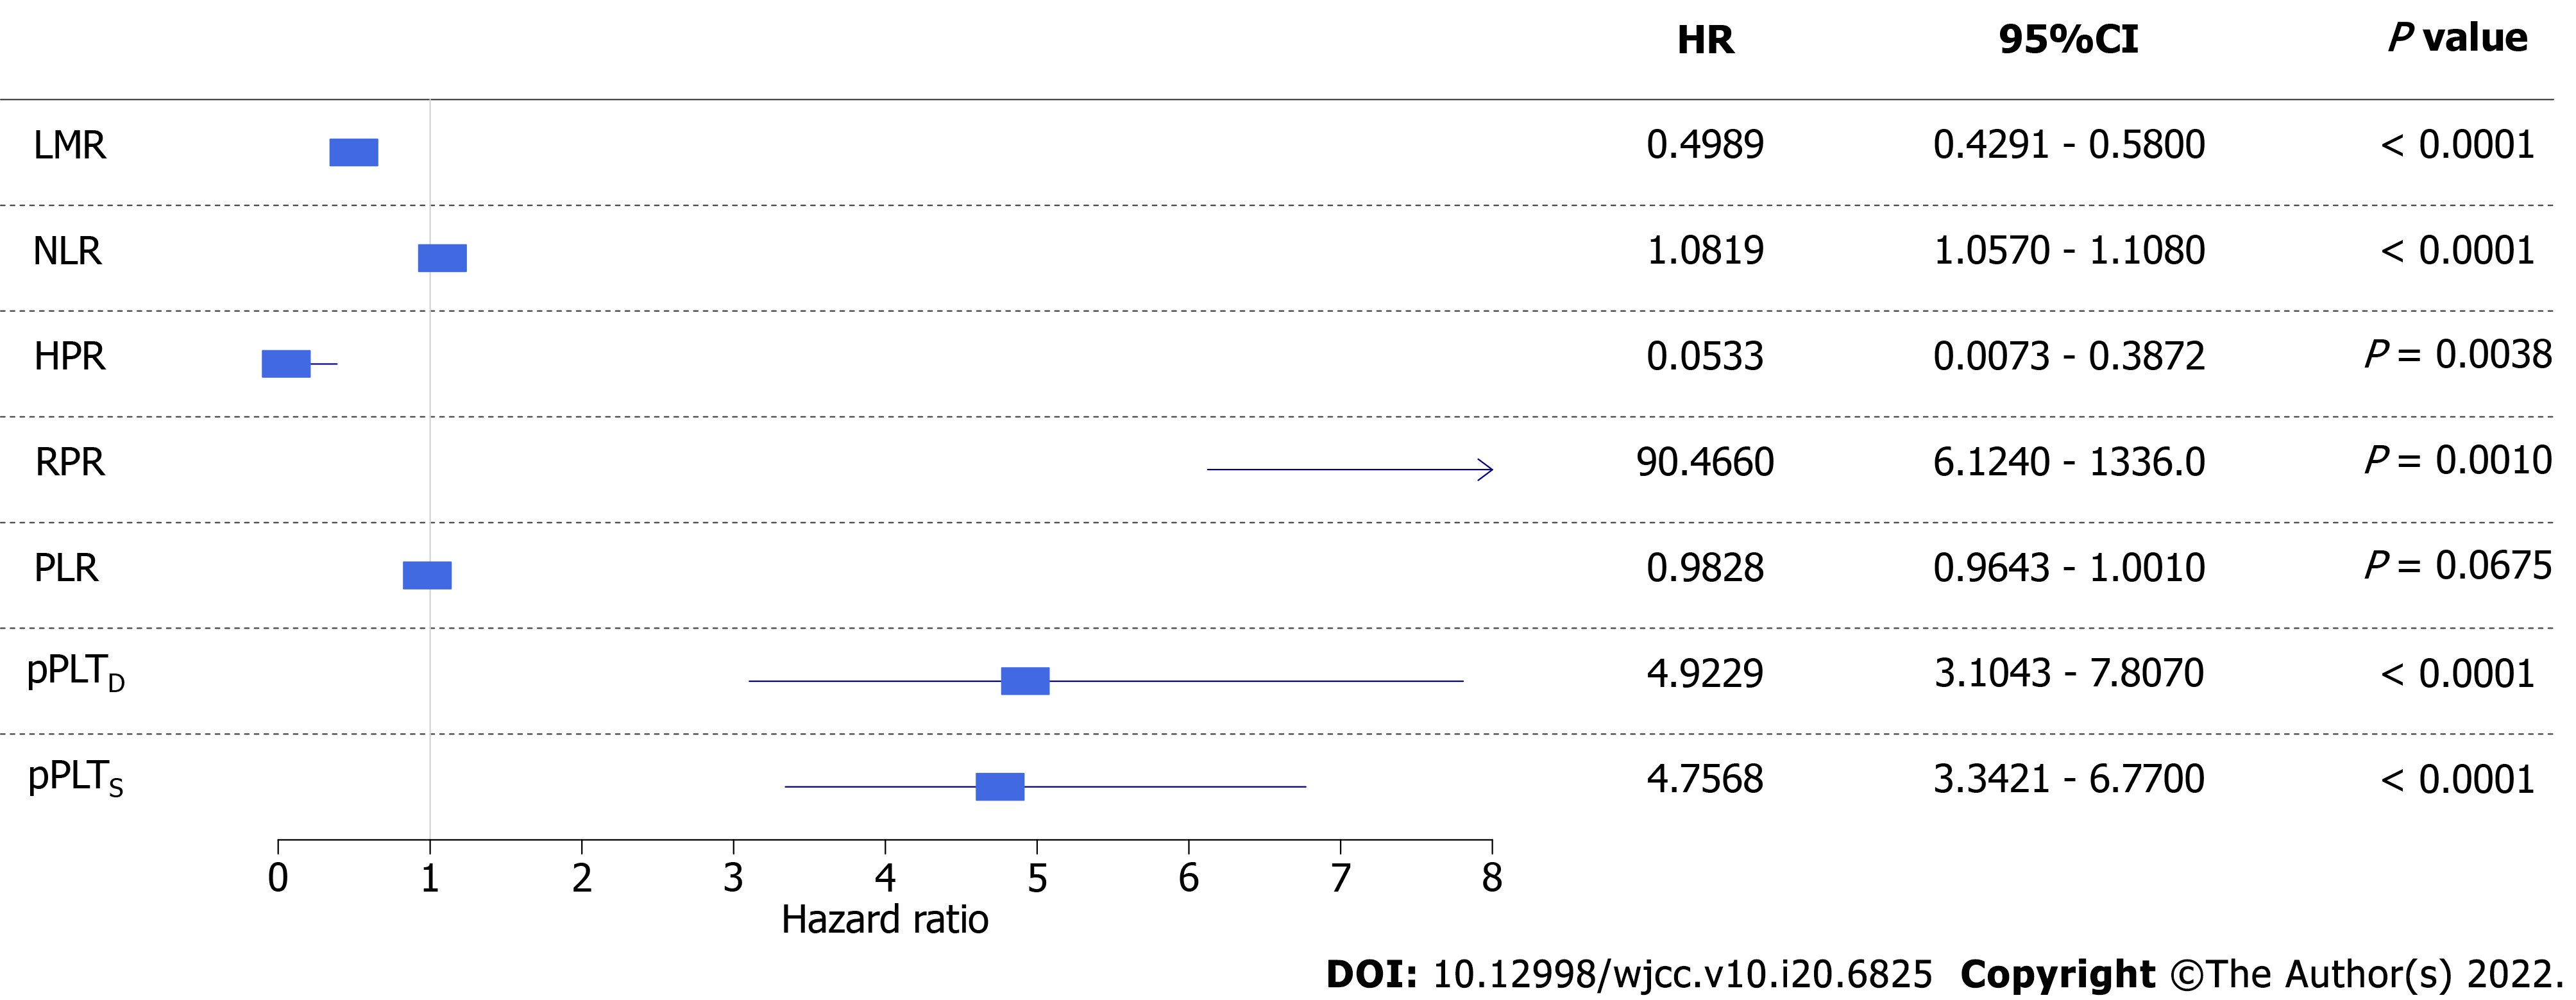
Figure 7 Forest plot of univariate competing risk models with time-dependent covariate.
Higher risk of disease-specific mortality was associated with a lower lymphocyte-to-monocyte ratio, hemoglobin-to-platelet ratio, and platelet-to-lymphocyte ratio, and higher red blood cell distribution width-to-platelet ratio, personalized platelet count relative to “at-diagnosis”, and personalized platelet count relative to “after-surgery”. Neutrophil-to-lymphocyte ratio did not affect disease-specific mortality of study participants. CI: Confidence interval; HR: Hazard ratio. LMR: Lymphocyte-to-monocyte ratio; PLR: Platelet-to-lymphocyte ratio; NLR: Neutrophil-to-lymphocyte ratio; HPR: hemoglobin-to-platelet ratio; RPR: red blood cell distribution width-to-platelet ratio; pPLTD: Personalized platelet count relative to “at-diagnosis”; pPLTS: Personalized platelet count relative to “after-surgery”.
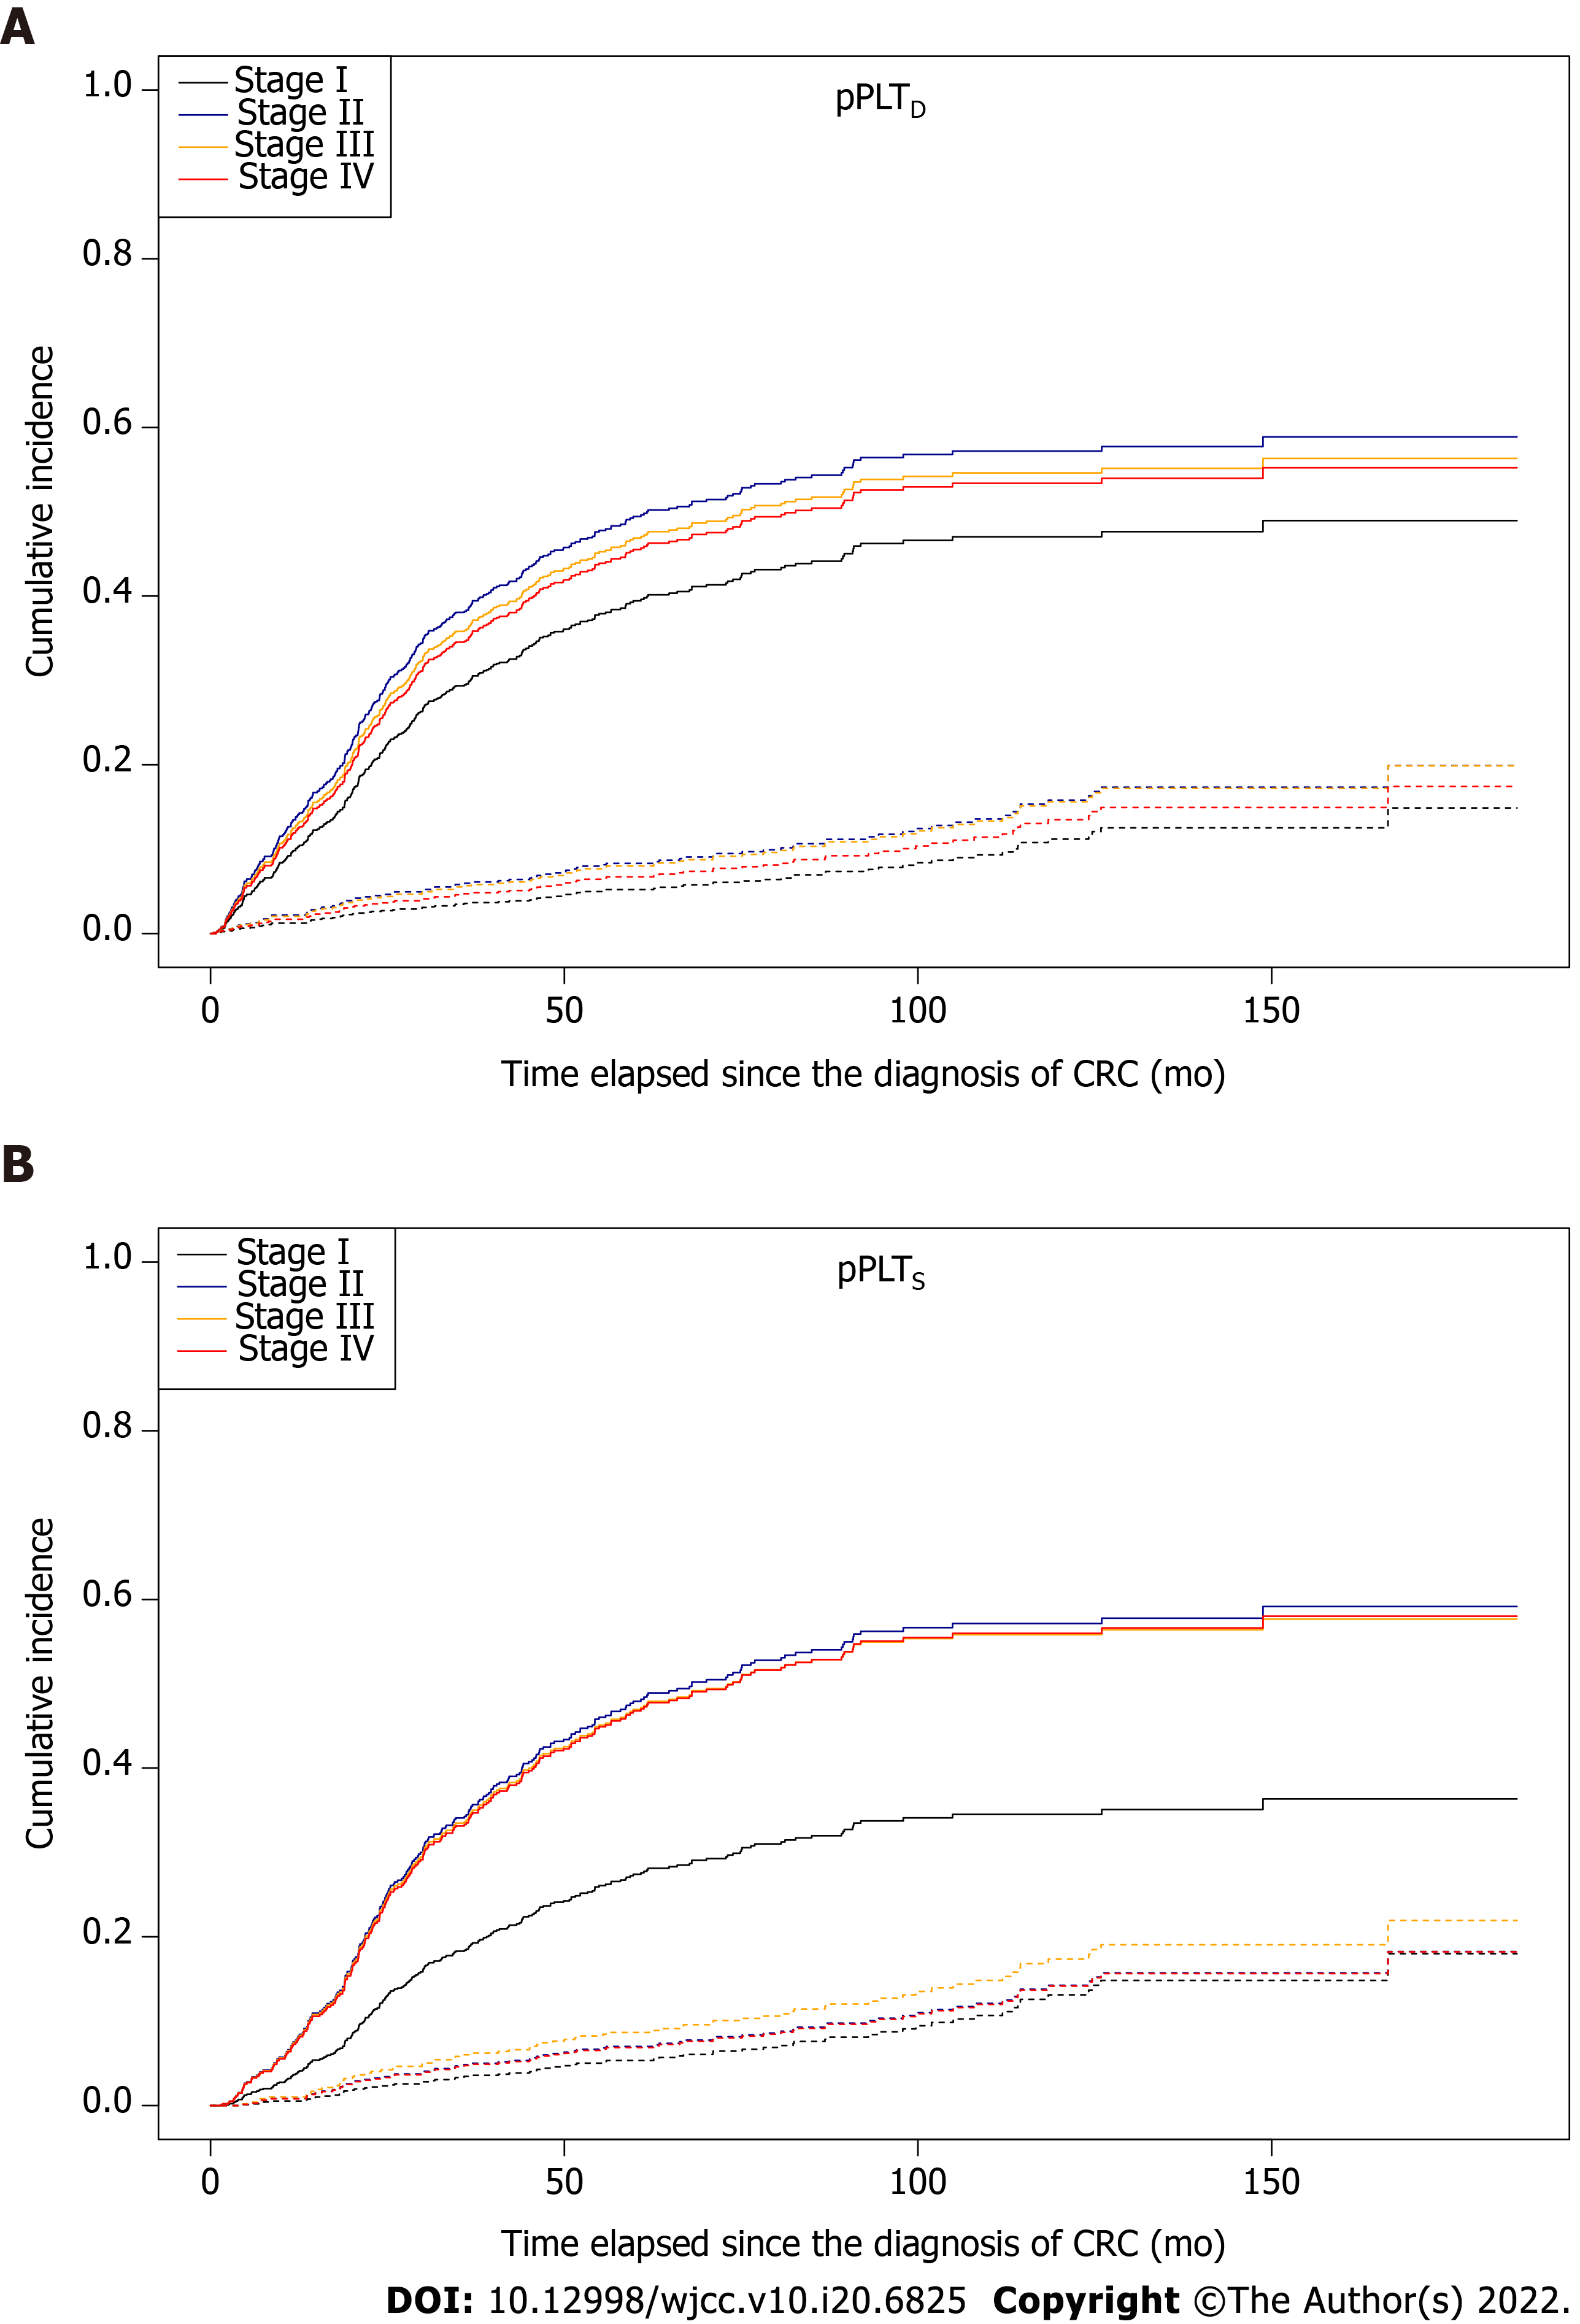
Figure 8 Survival curves for two competing events, stratified by American Joint Committee on Cancer staging[21], in colorectal cancer patients.
Solid and dashed lines represent disease-specific death and non-cancer related death, respectively. A: The effect of the stage on patient survival was marginal in the case of personalized platelet count relative to “at-diagnosis” (pPLTD, Stage I vs Stage II: P = 0.0847); B: A significant difference was found in personalized platelet count relative to “after-surgery” (pPLTS, Stage I vs Stage II: P = 0.0314; Stage I vs Stage III: P = 0.0594; Stage I vs Stage IV: P = 0.0335). pPLTD: Personalized platelet count relative to “at-diagnosis”; pPLTS: Personalized platelet count relative to “after-surgery”.
- Citation: Herold Z, Herold M, Lohinszky J, Szasz AM, Dank M, Somogyi A. Longitudinal changes in personalized platelet count metrics are good indicators of initial 3-year outcome in colorectal cancer. World J Clin Cases 2022; 10(20): 6825-6844
- URL: https://www.wjgnet.com/2307-8960/full/v10/i20/6825.htm
- DOI: https://dx.doi.org/10.12998/wjcc.v10.i20.6825


