Copyright
©The Author(s) 2022.
World J Clin Cases. Jul 6, 2022; 10(19): 6483-6495
Published online Jul 6, 2022. doi: 10.12998/wjcc.v10.i19.6483
Published online Jul 6, 2022. doi: 10.12998/wjcc.v10.i19.6483
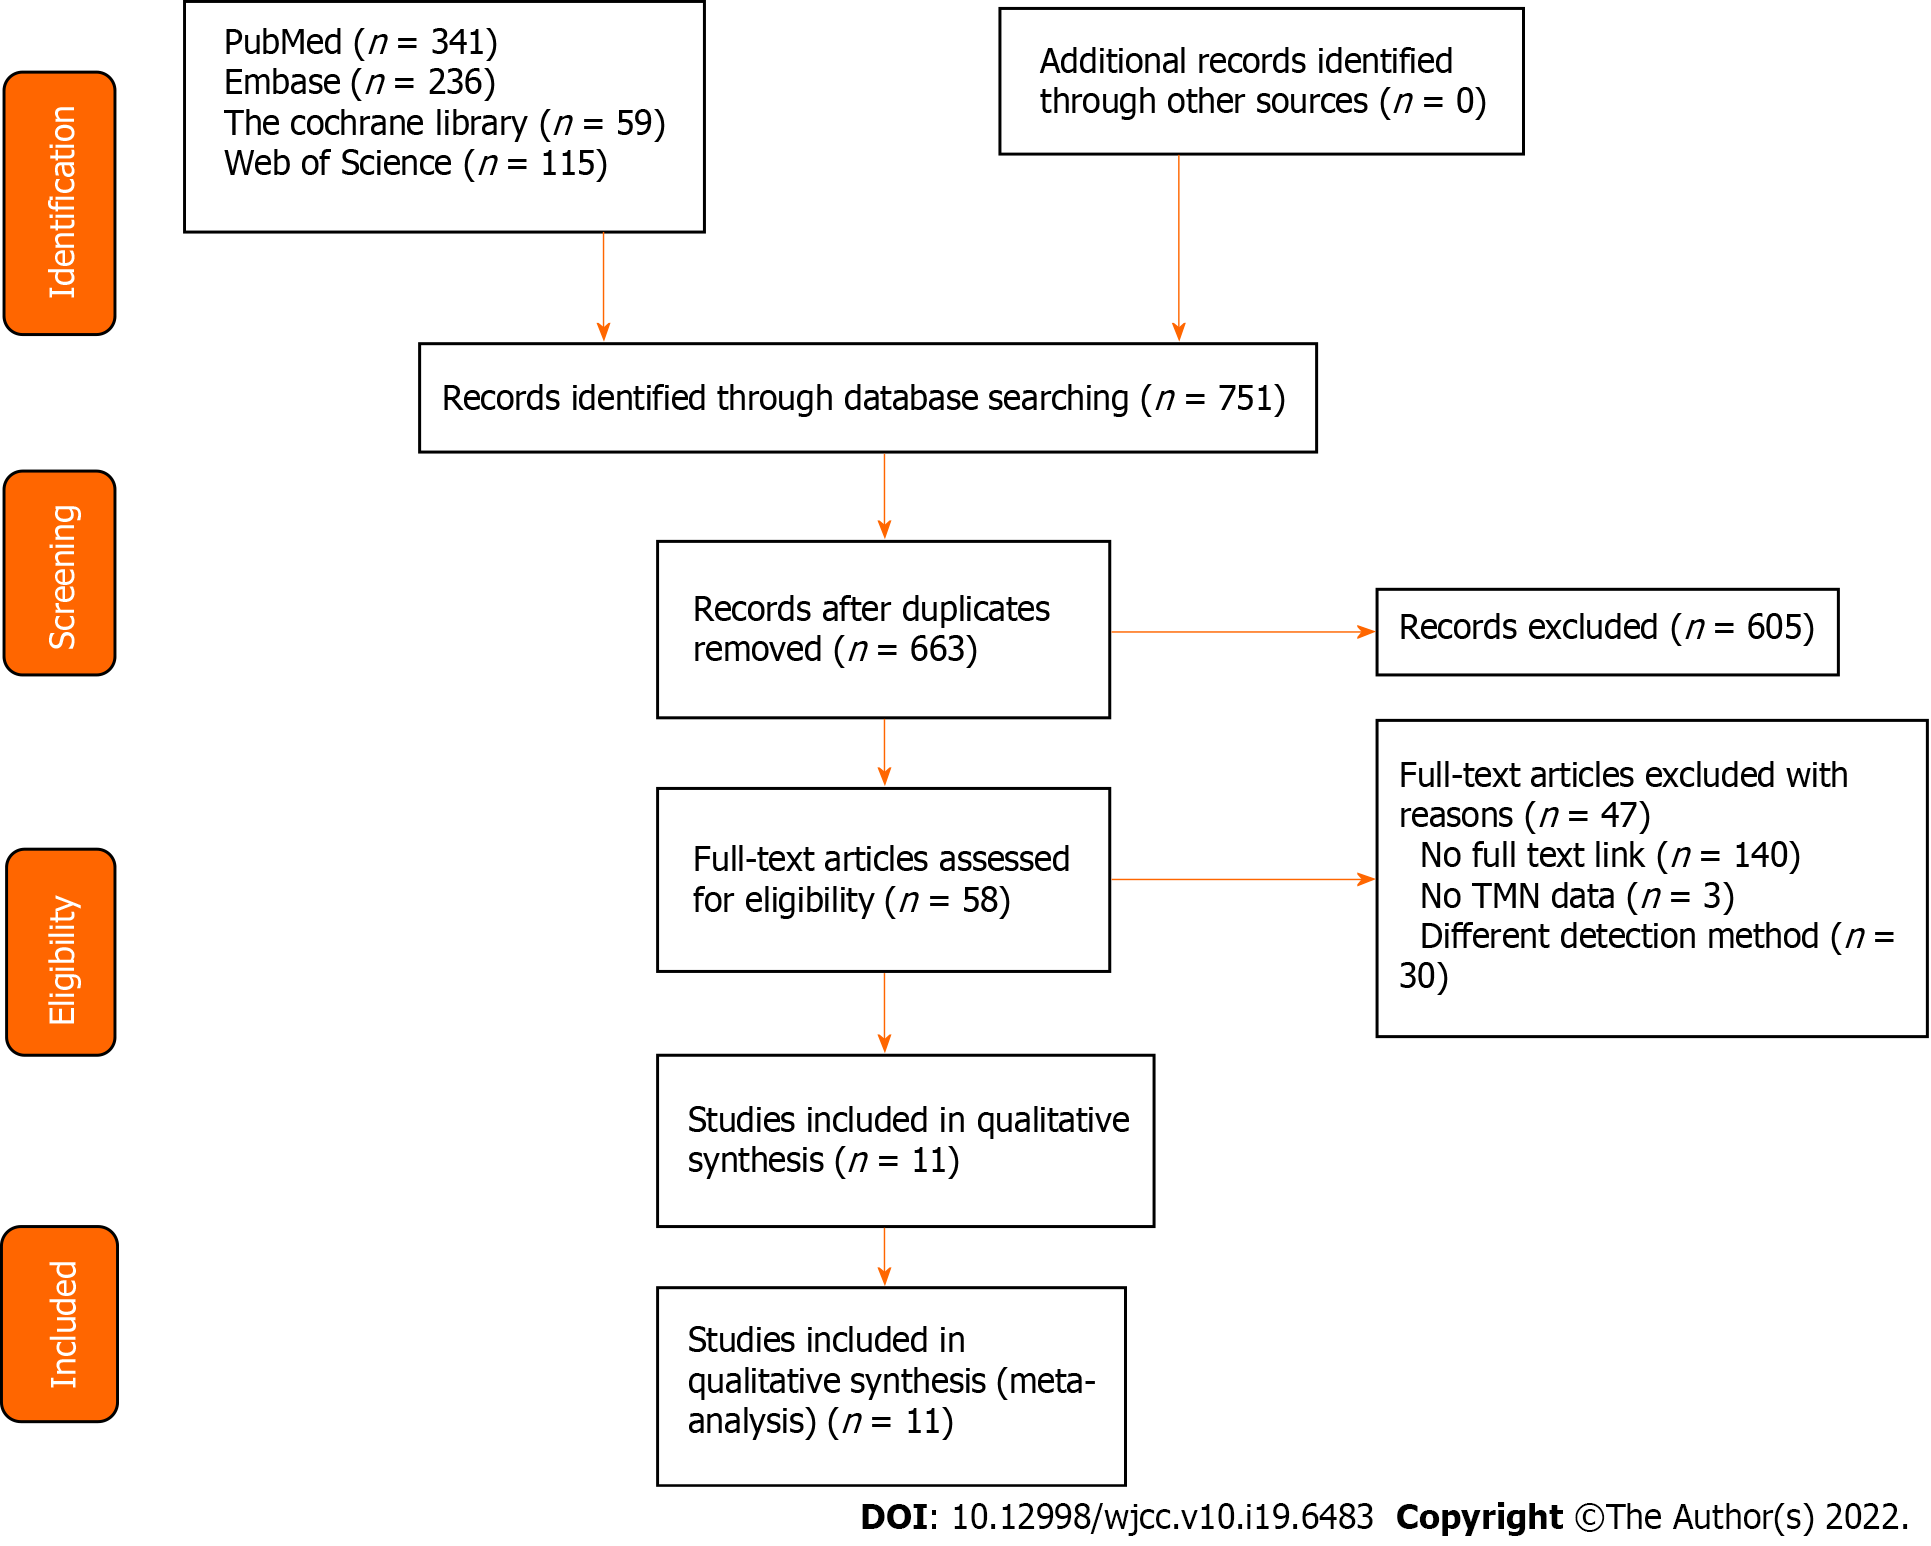
Figure 1 Literature search and results.
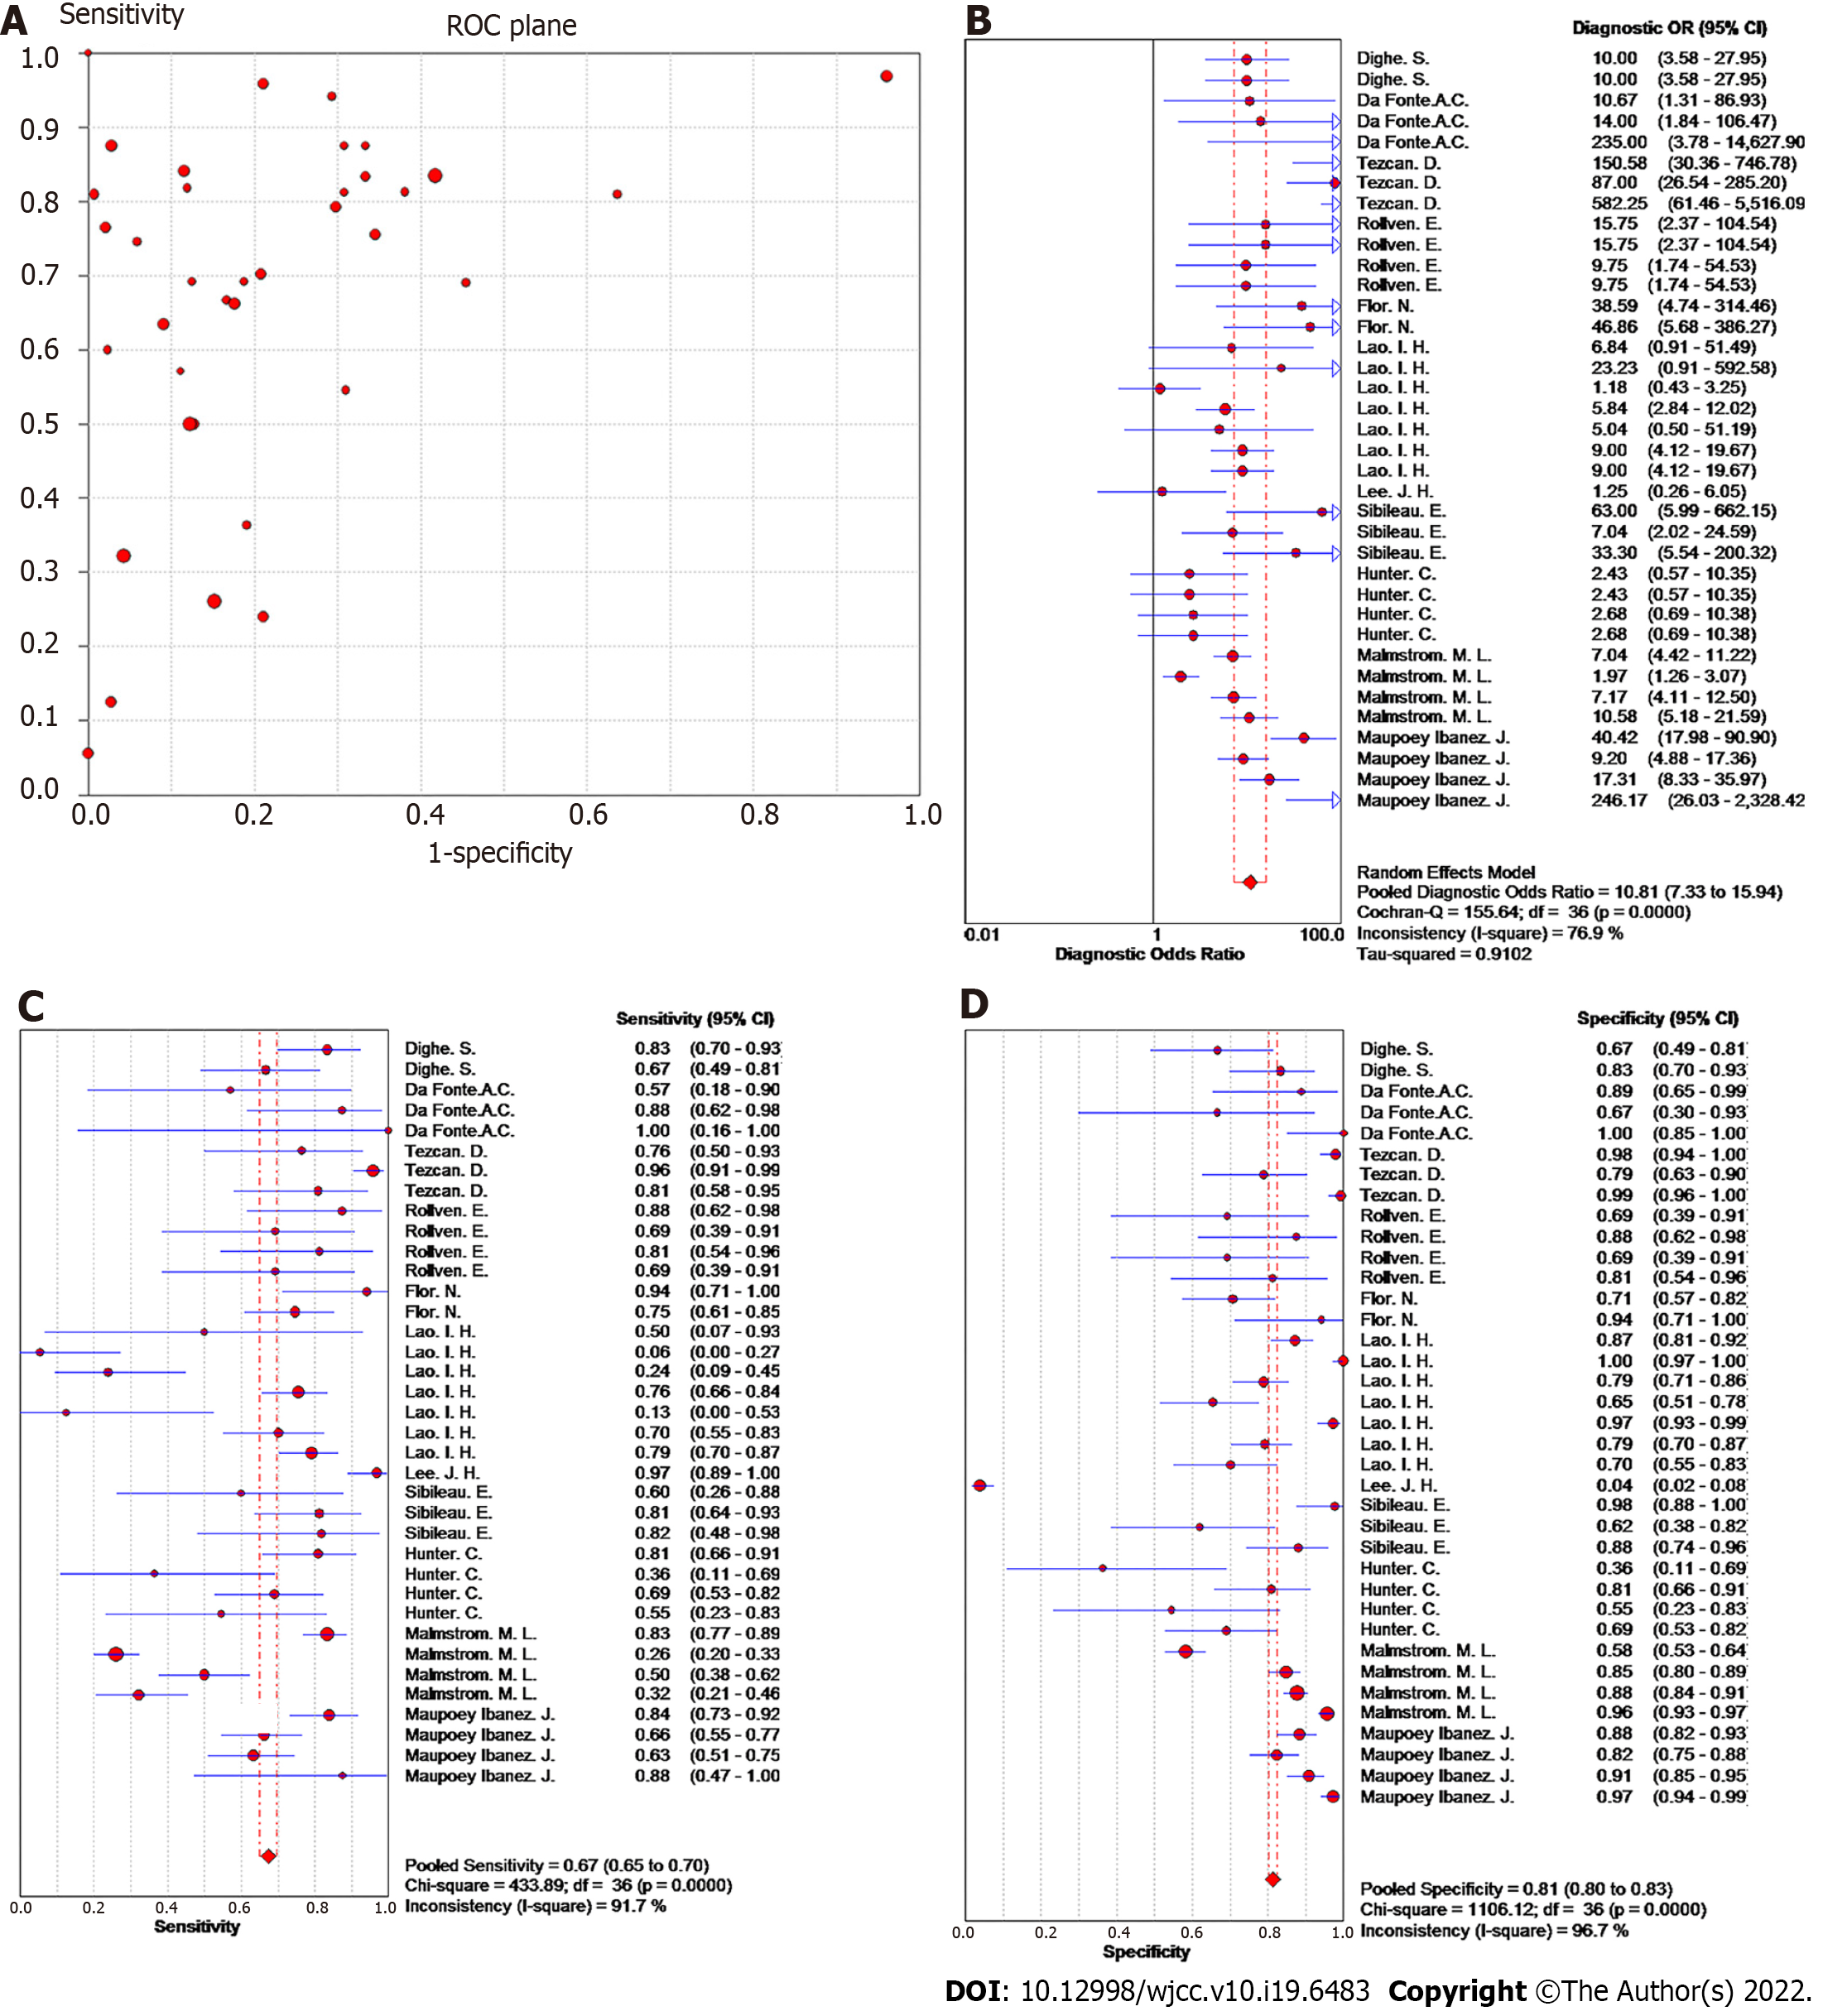
Figure 2 Forest plot of meta-analysis of studies using ≥ 16-slice computed tomography for colorectal cancer T staging.
A: Receiver operating characteristic plan; B: Forest plot of diagnostic odds ratio; C: Forest plot of sensitivity; D: Forest plot of specificity.
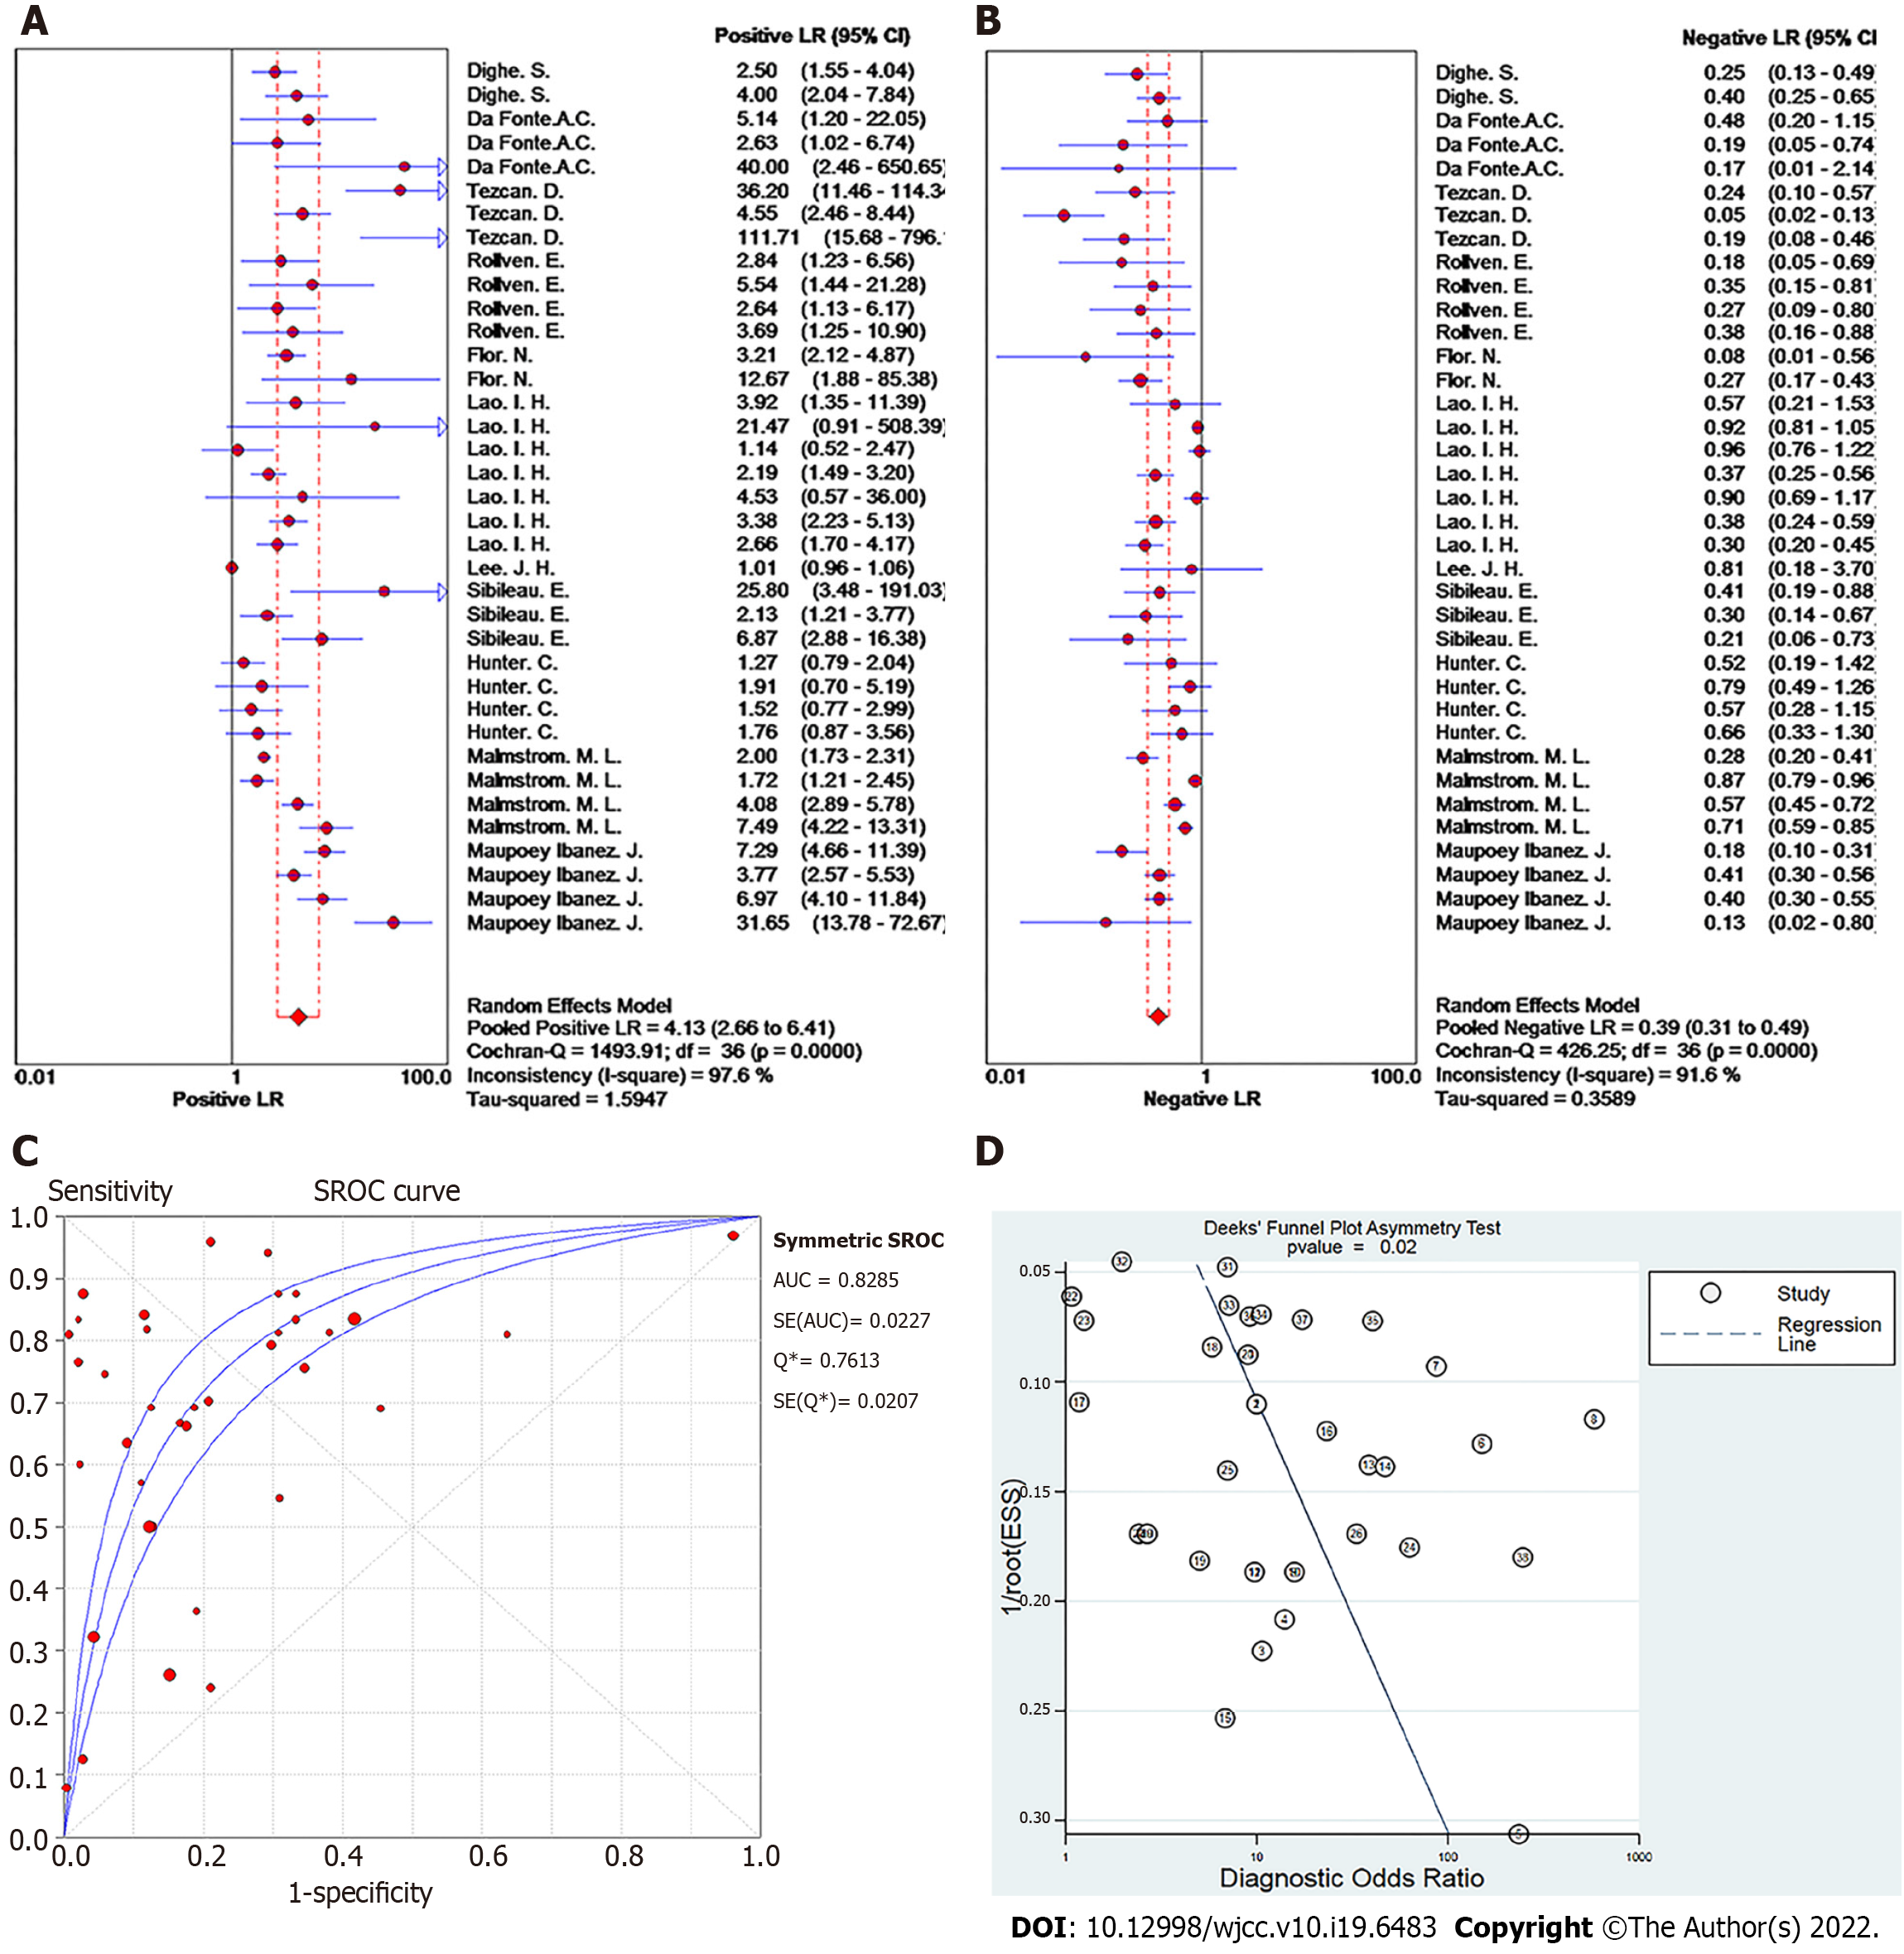
Figure 3 Forest plot of meta-analysis of studies using ≥ 16-slice computed tomography for colorectal cancer T staging.
A: Positive LR; B: Negative LR; C: Summary receiver operating characteristic curve; D: Deeks' funnel plot.
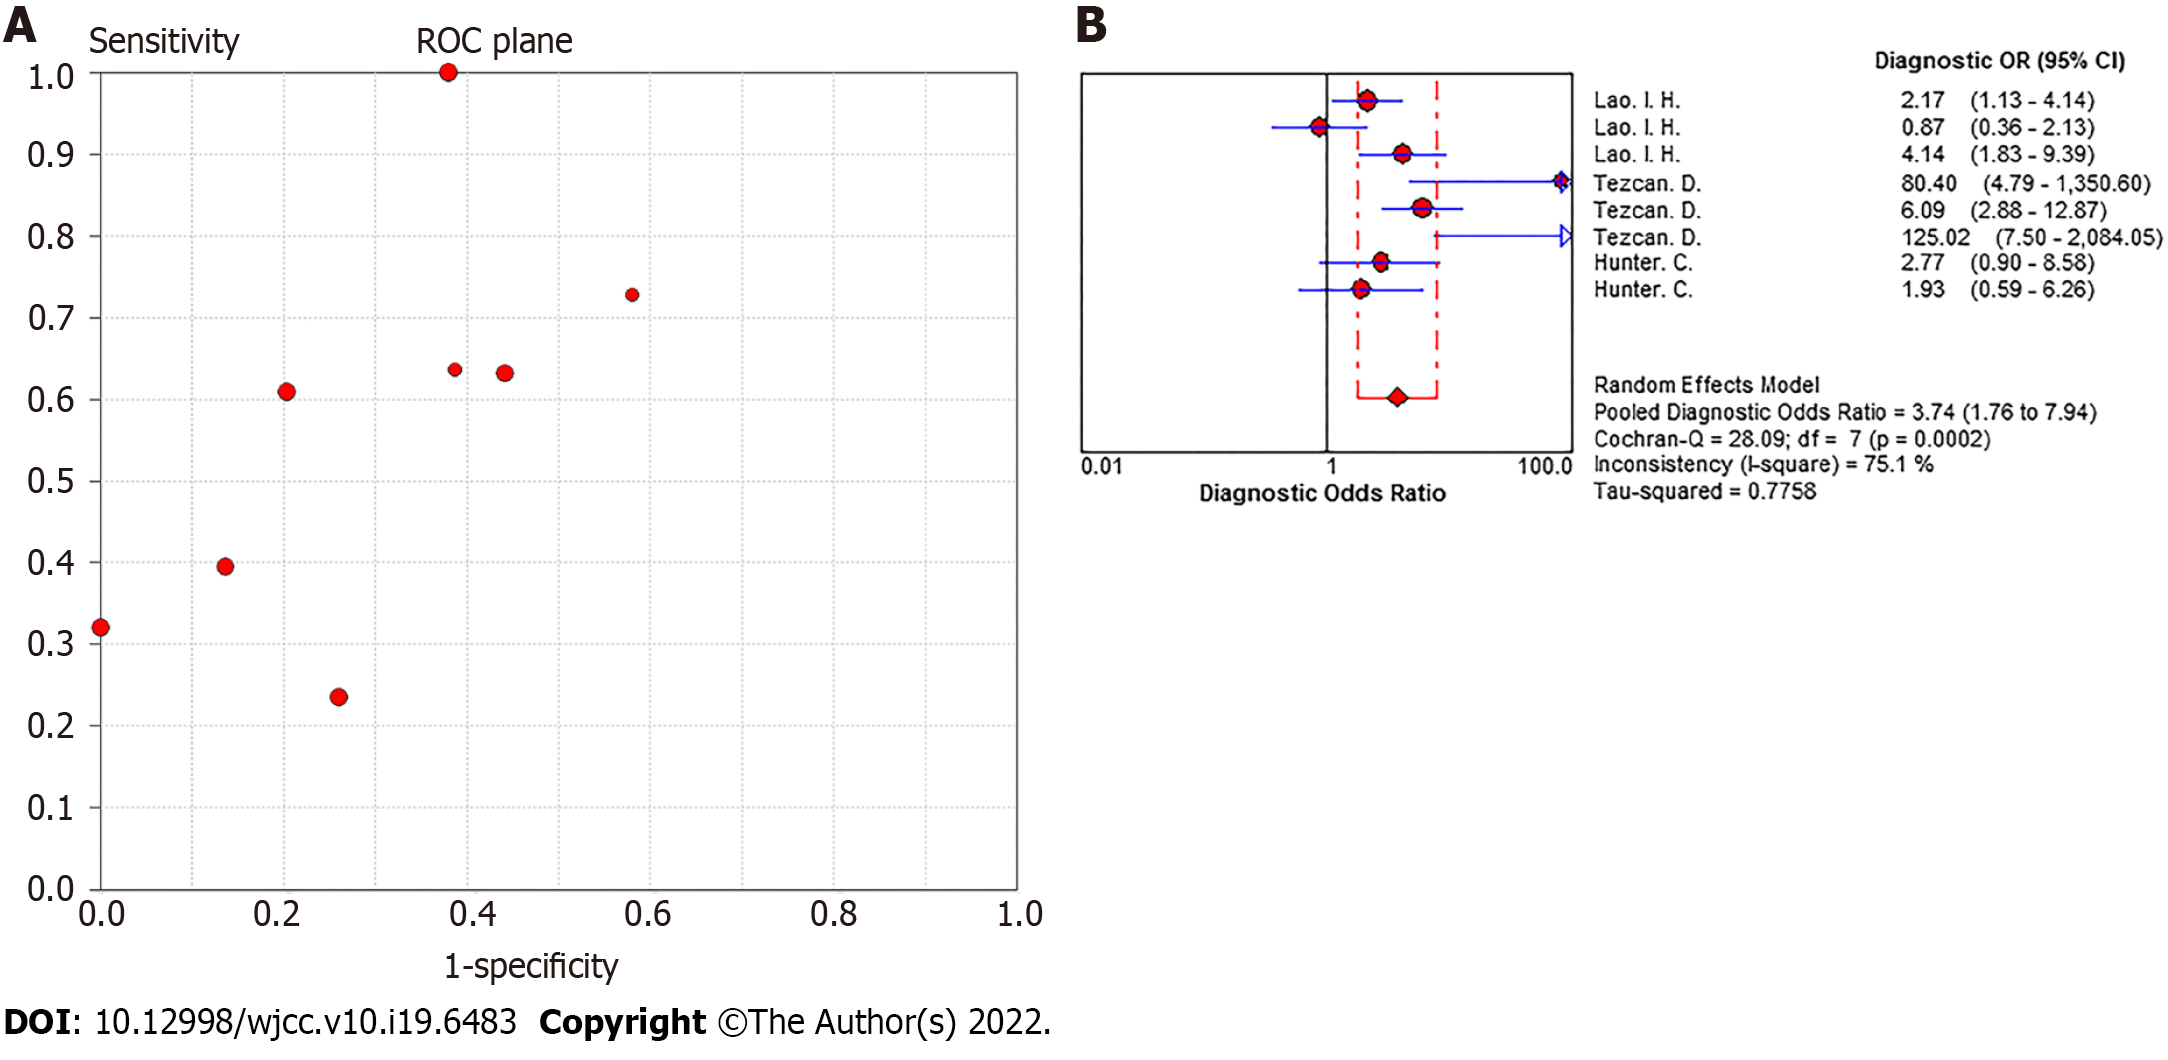
Figure 4 Pooled effect plot of ≥ 16-slice computed tomography for colorectal cancer N staging.
A: Receiver operating characteristic plan; B: Diagnostic odds ratio.
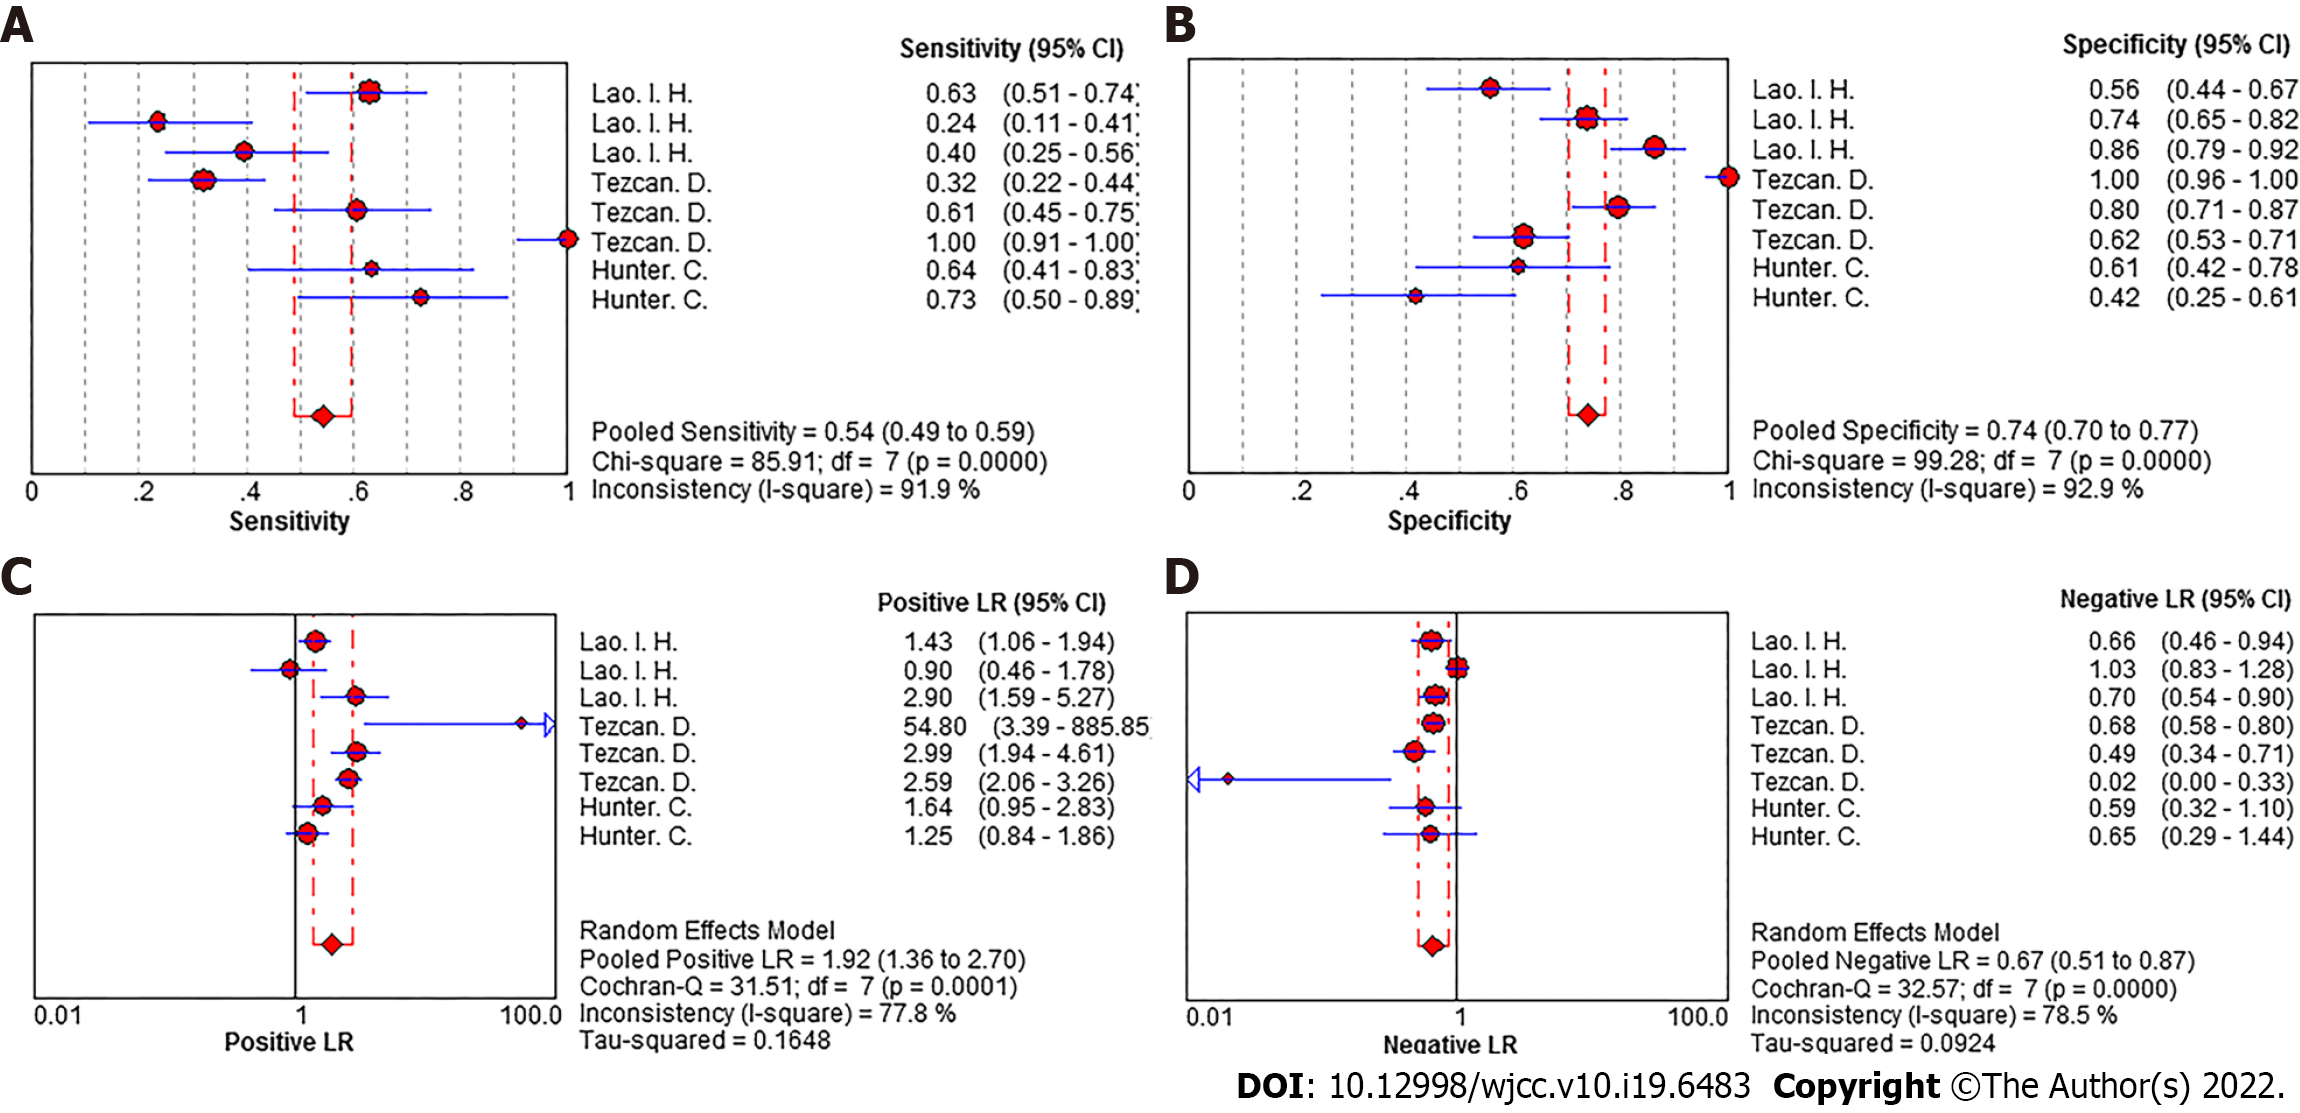
Figure 5 Forest plot of summary effect of ≥ 16-slice computed tomography for colorectal cancer N staging.
A: Sensitivity; B: Specificity; C: Positive LR; D: Negative LR.
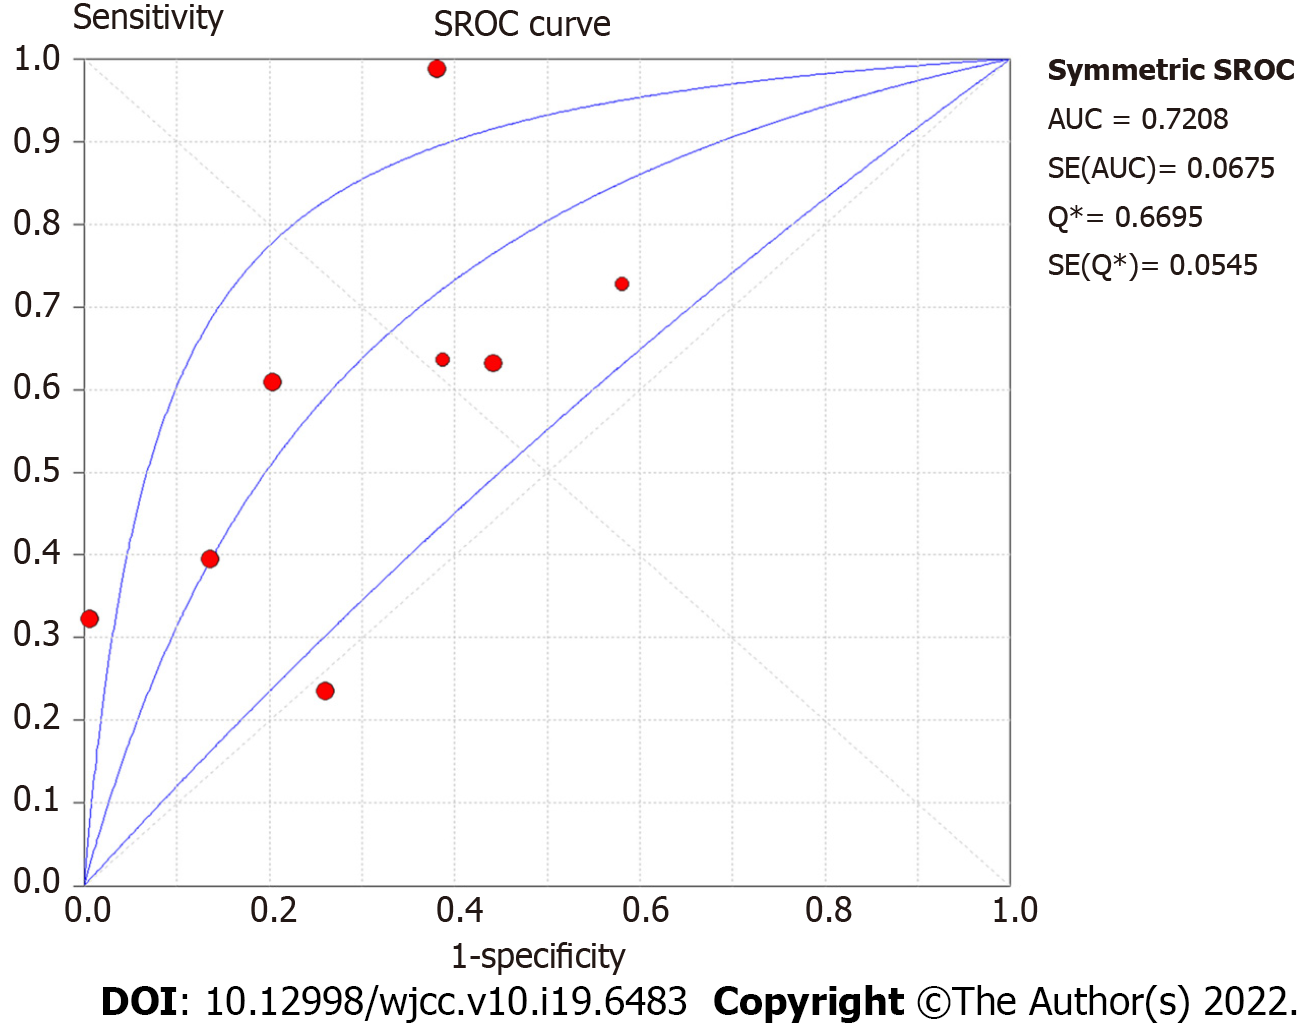
Figure 6 Summary receiver operating characteristic curve of ≥ 16-slice computed tomography for colorectal cancer N staging.
- Citation: Liu D, Sun LM, Liang JH, Song L, Liu XP. Diagnostic accuracy of ≥ 16-slice spiral computed tomography for local staging of colon cancer: A systematic review and meta-analysis. World J Clin Cases 2022; 10(19): 6483-6495
- URL: https://www.wjgnet.com/2307-8960/full/v10/i19/6483.htm
- DOI: https://dx.doi.org/10.12998/wjcc.v10.i19.6483


