Copyright
©The Author(s) 2022.
World J Clin Cases. May 16, 2022; 10(14): 4661-4668
Published online May 16, 2022. doi: 10.12998/wjcc.v10.i14.4661
Published online May 16, 2022. doi: 10.12998/wjcc.v10.i14.4661
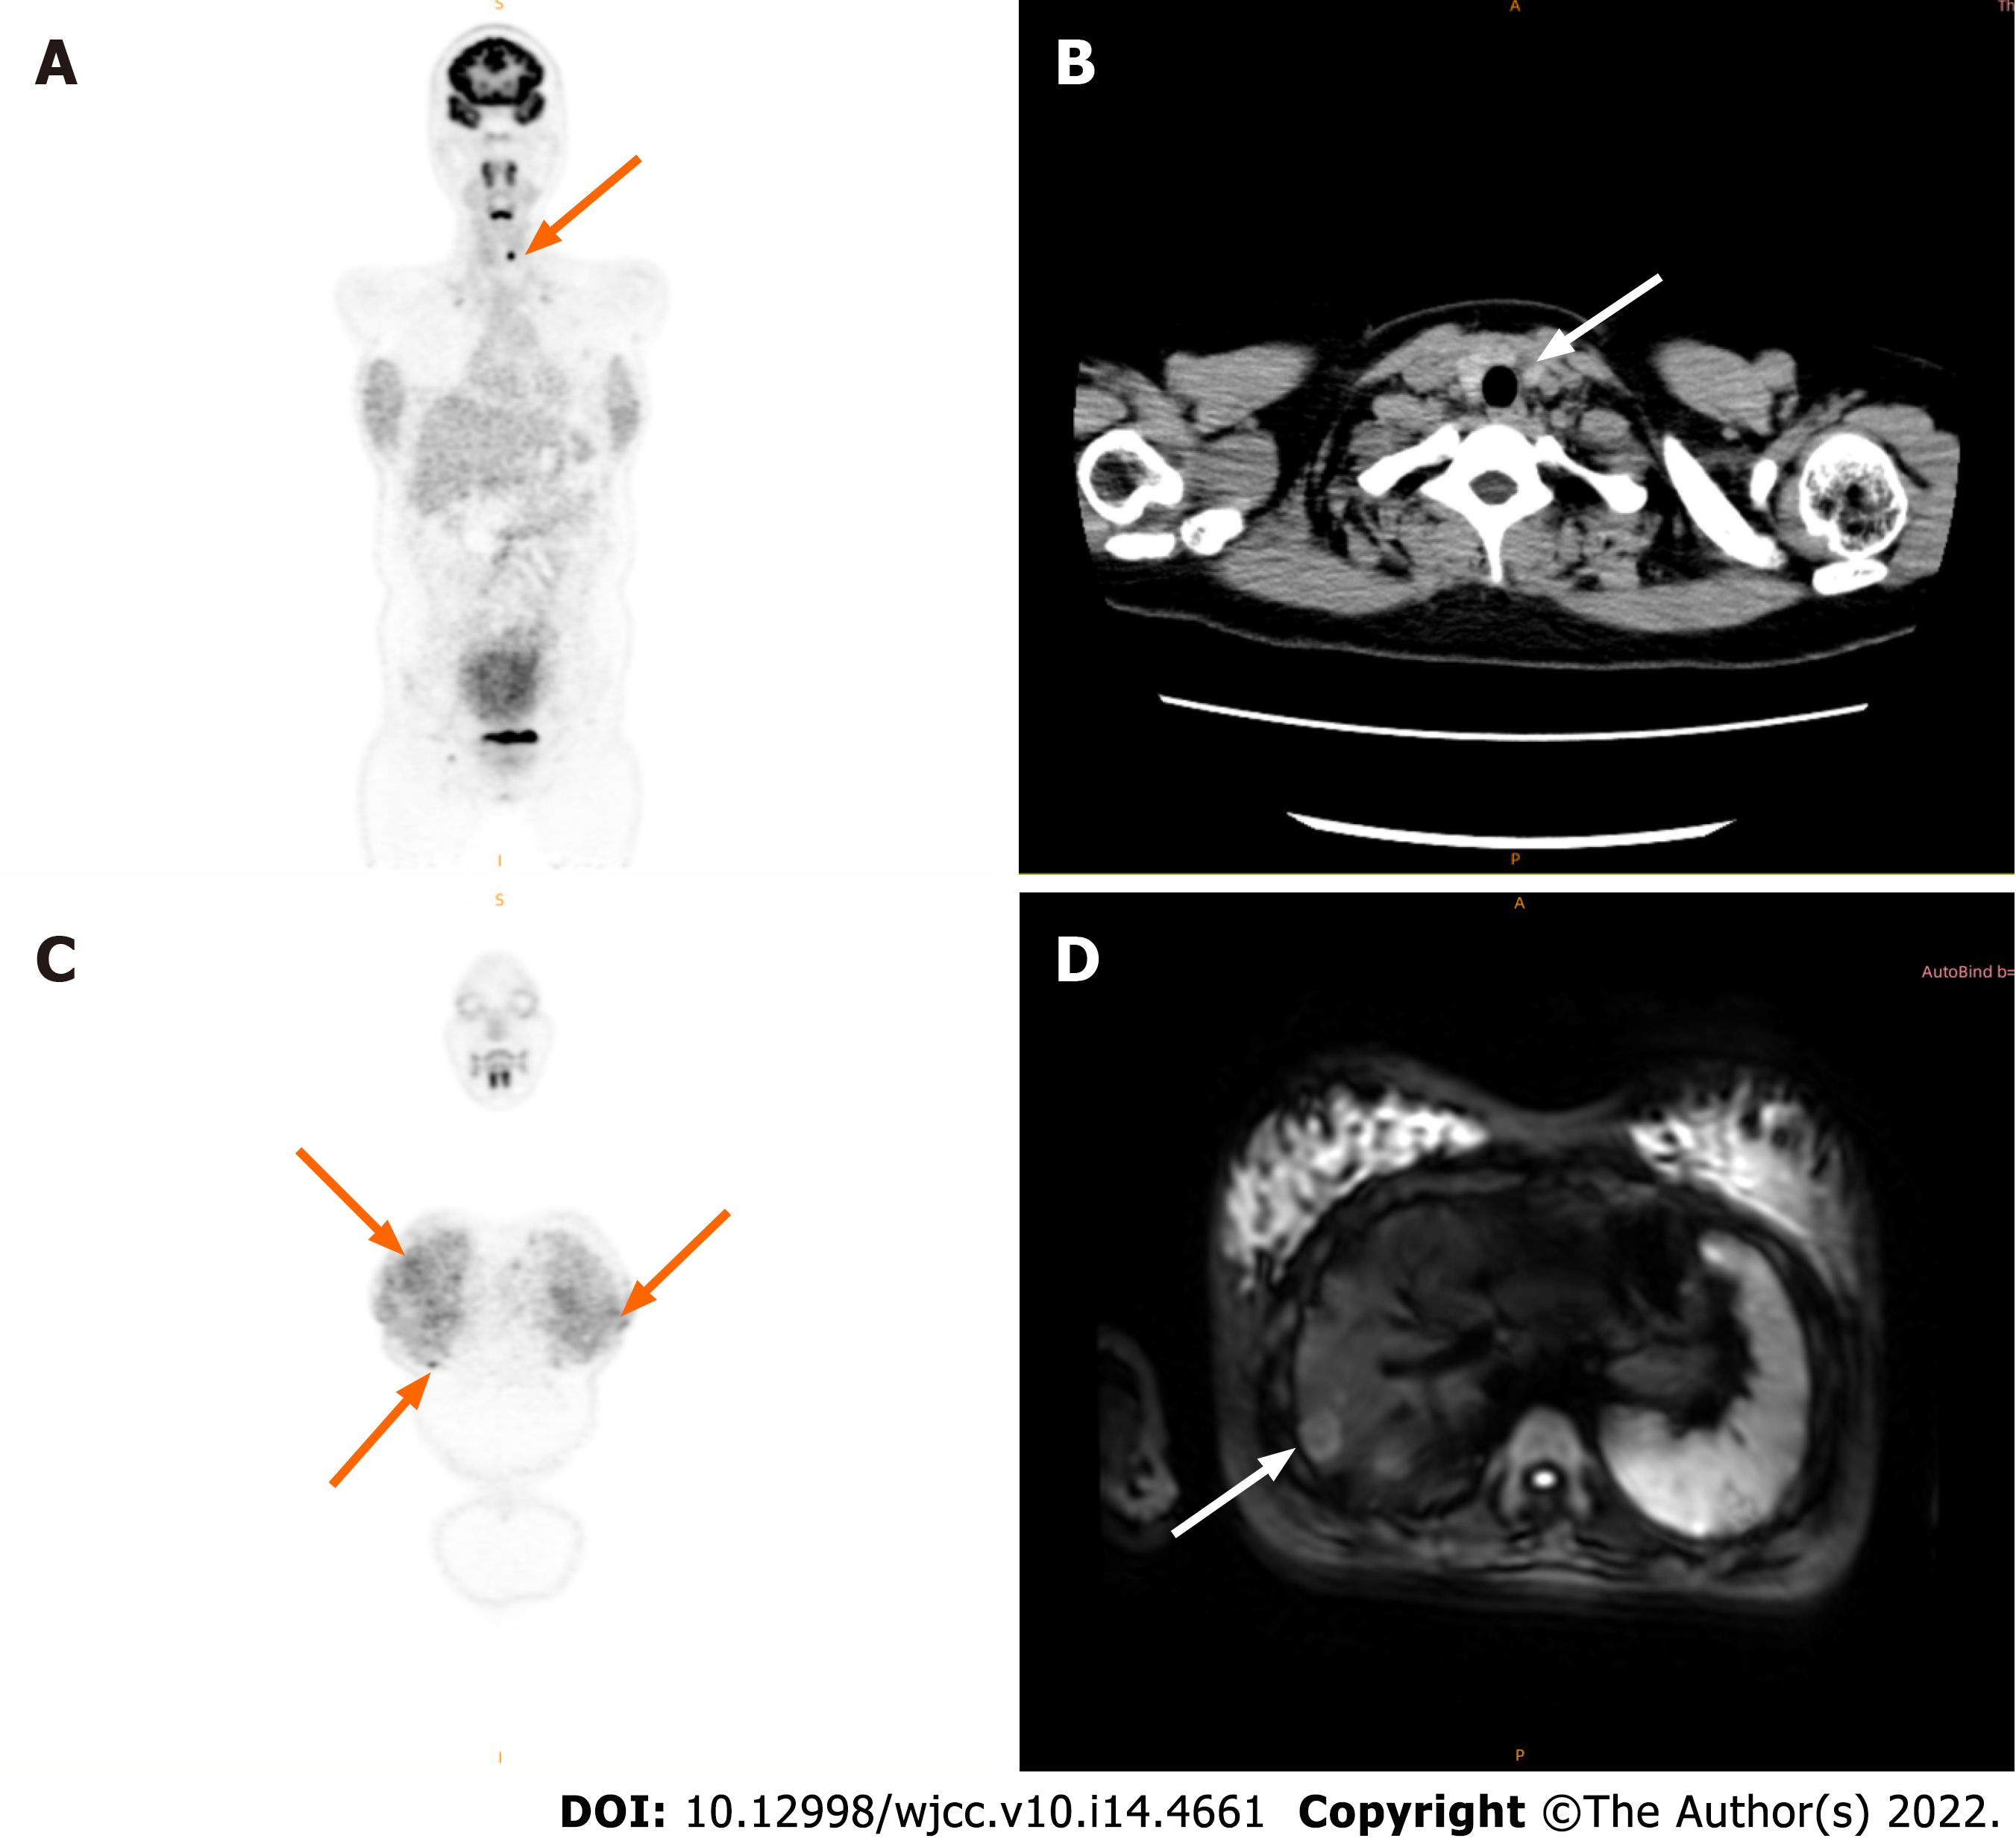
Figure 1 Positron emission tomography/magnetic resonance imaging images.
A: High concentration iodine uptake in the left lobe of the thyroid (arrow); B: Plain computer tomography scan showing the lesions in the left lobe of the thyroid have low-density nodular changes (arrow) involving the thyroid capsule; C: Positron emission tomography (PET)/magnetic resonance imaging (MRI) images showing multiple diffuse nodules in the lung (arrow); D: PET-MRI showing a high concentration of iodide uptake in the liver metastases (arrow).
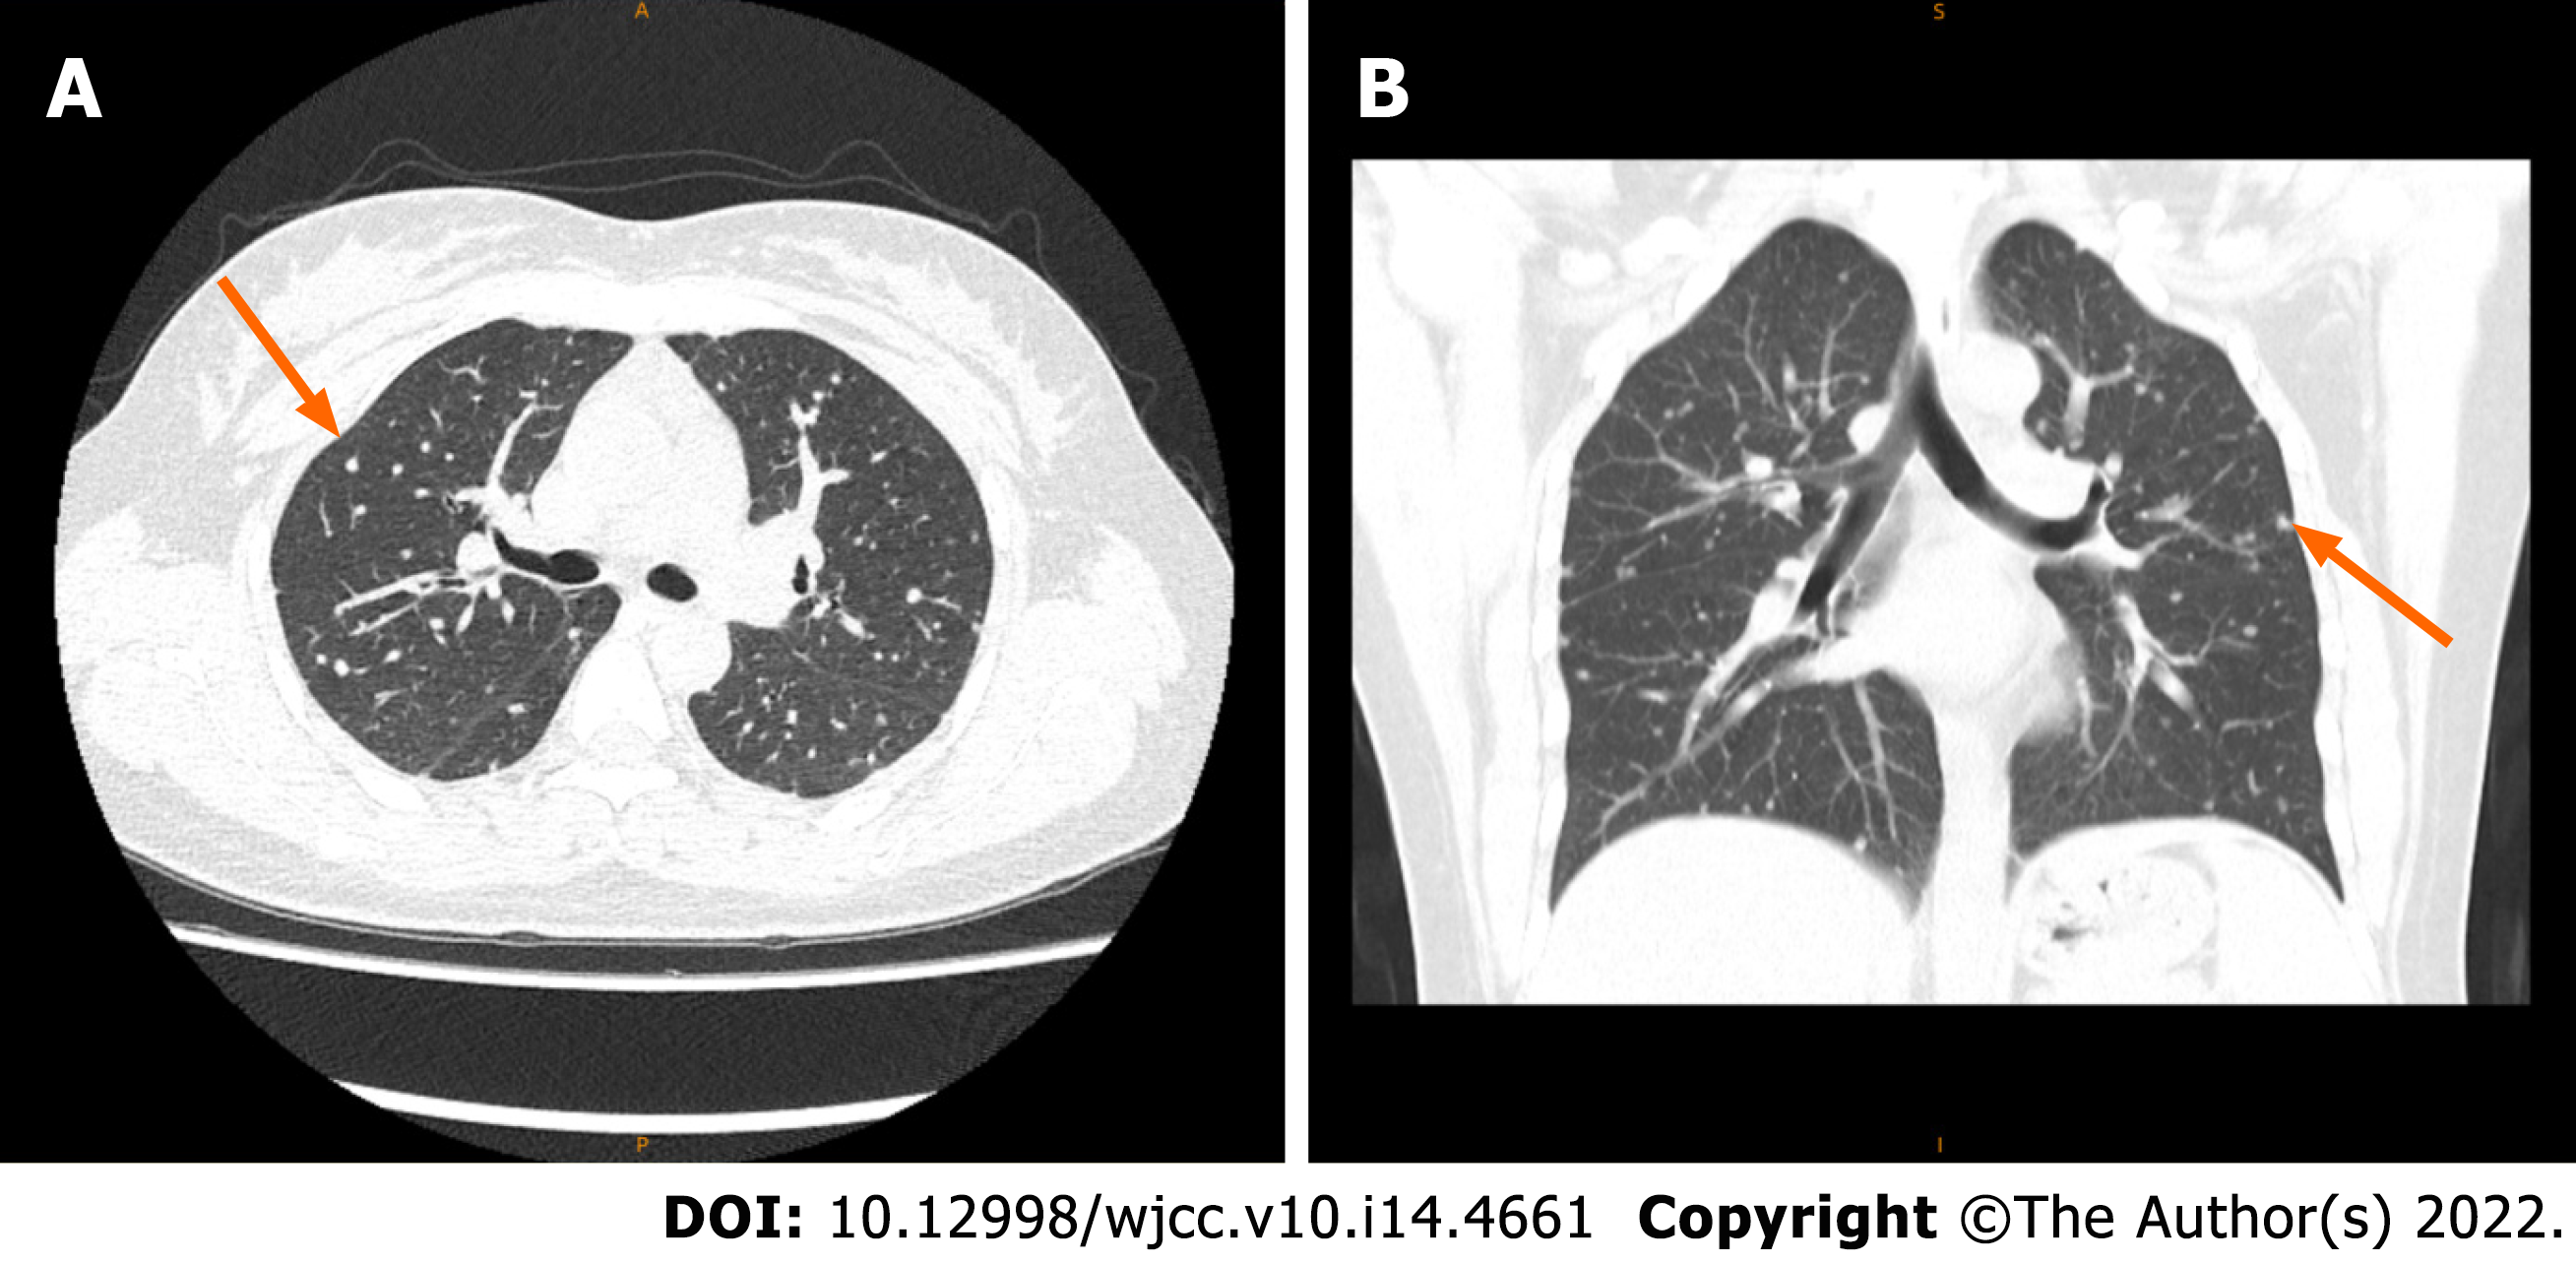
Figure 2 Chest computer tomography.
A-B: Multiple nodules in both lungs suggest metastasis (arrow).
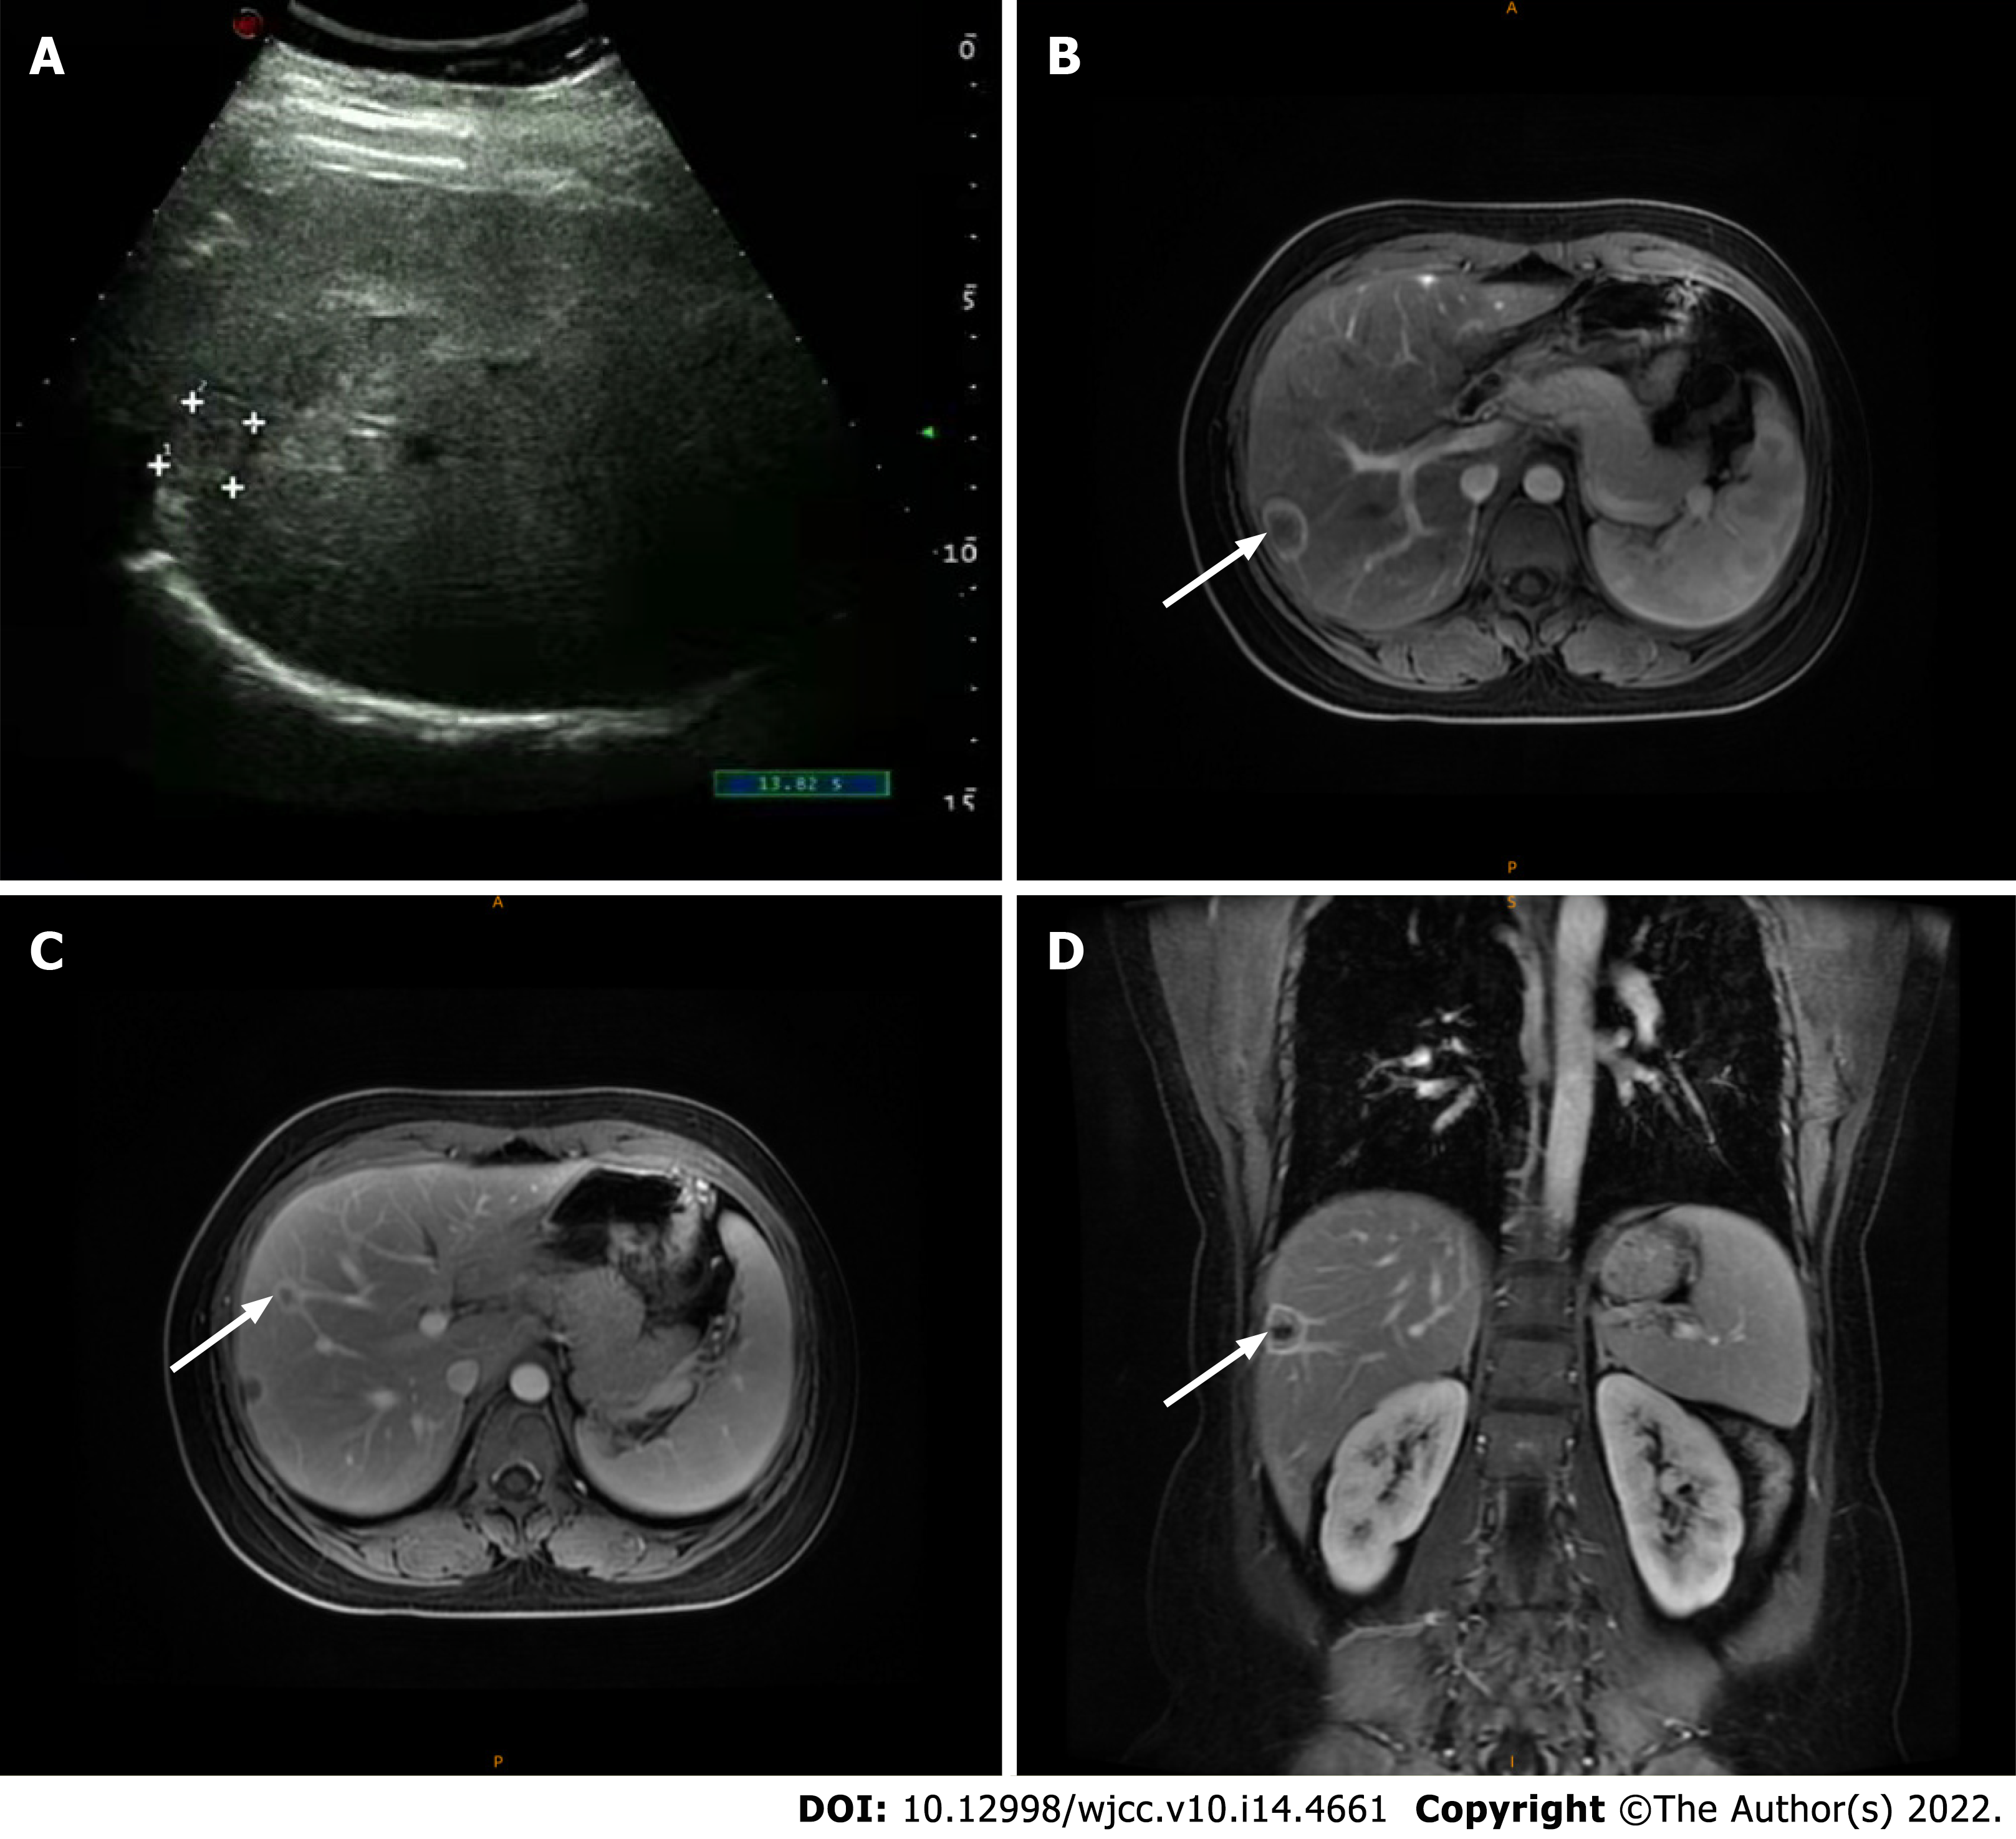
Figure 3 Liver metastasis.
A: Abdominal ultrasound showing mixed medium echo nodules near the hepatic capsule in the right lobe of the liver, suggesting metastasis; B-D: Liver magnetic resonance imaging showing multiple liver metastases (arrow).
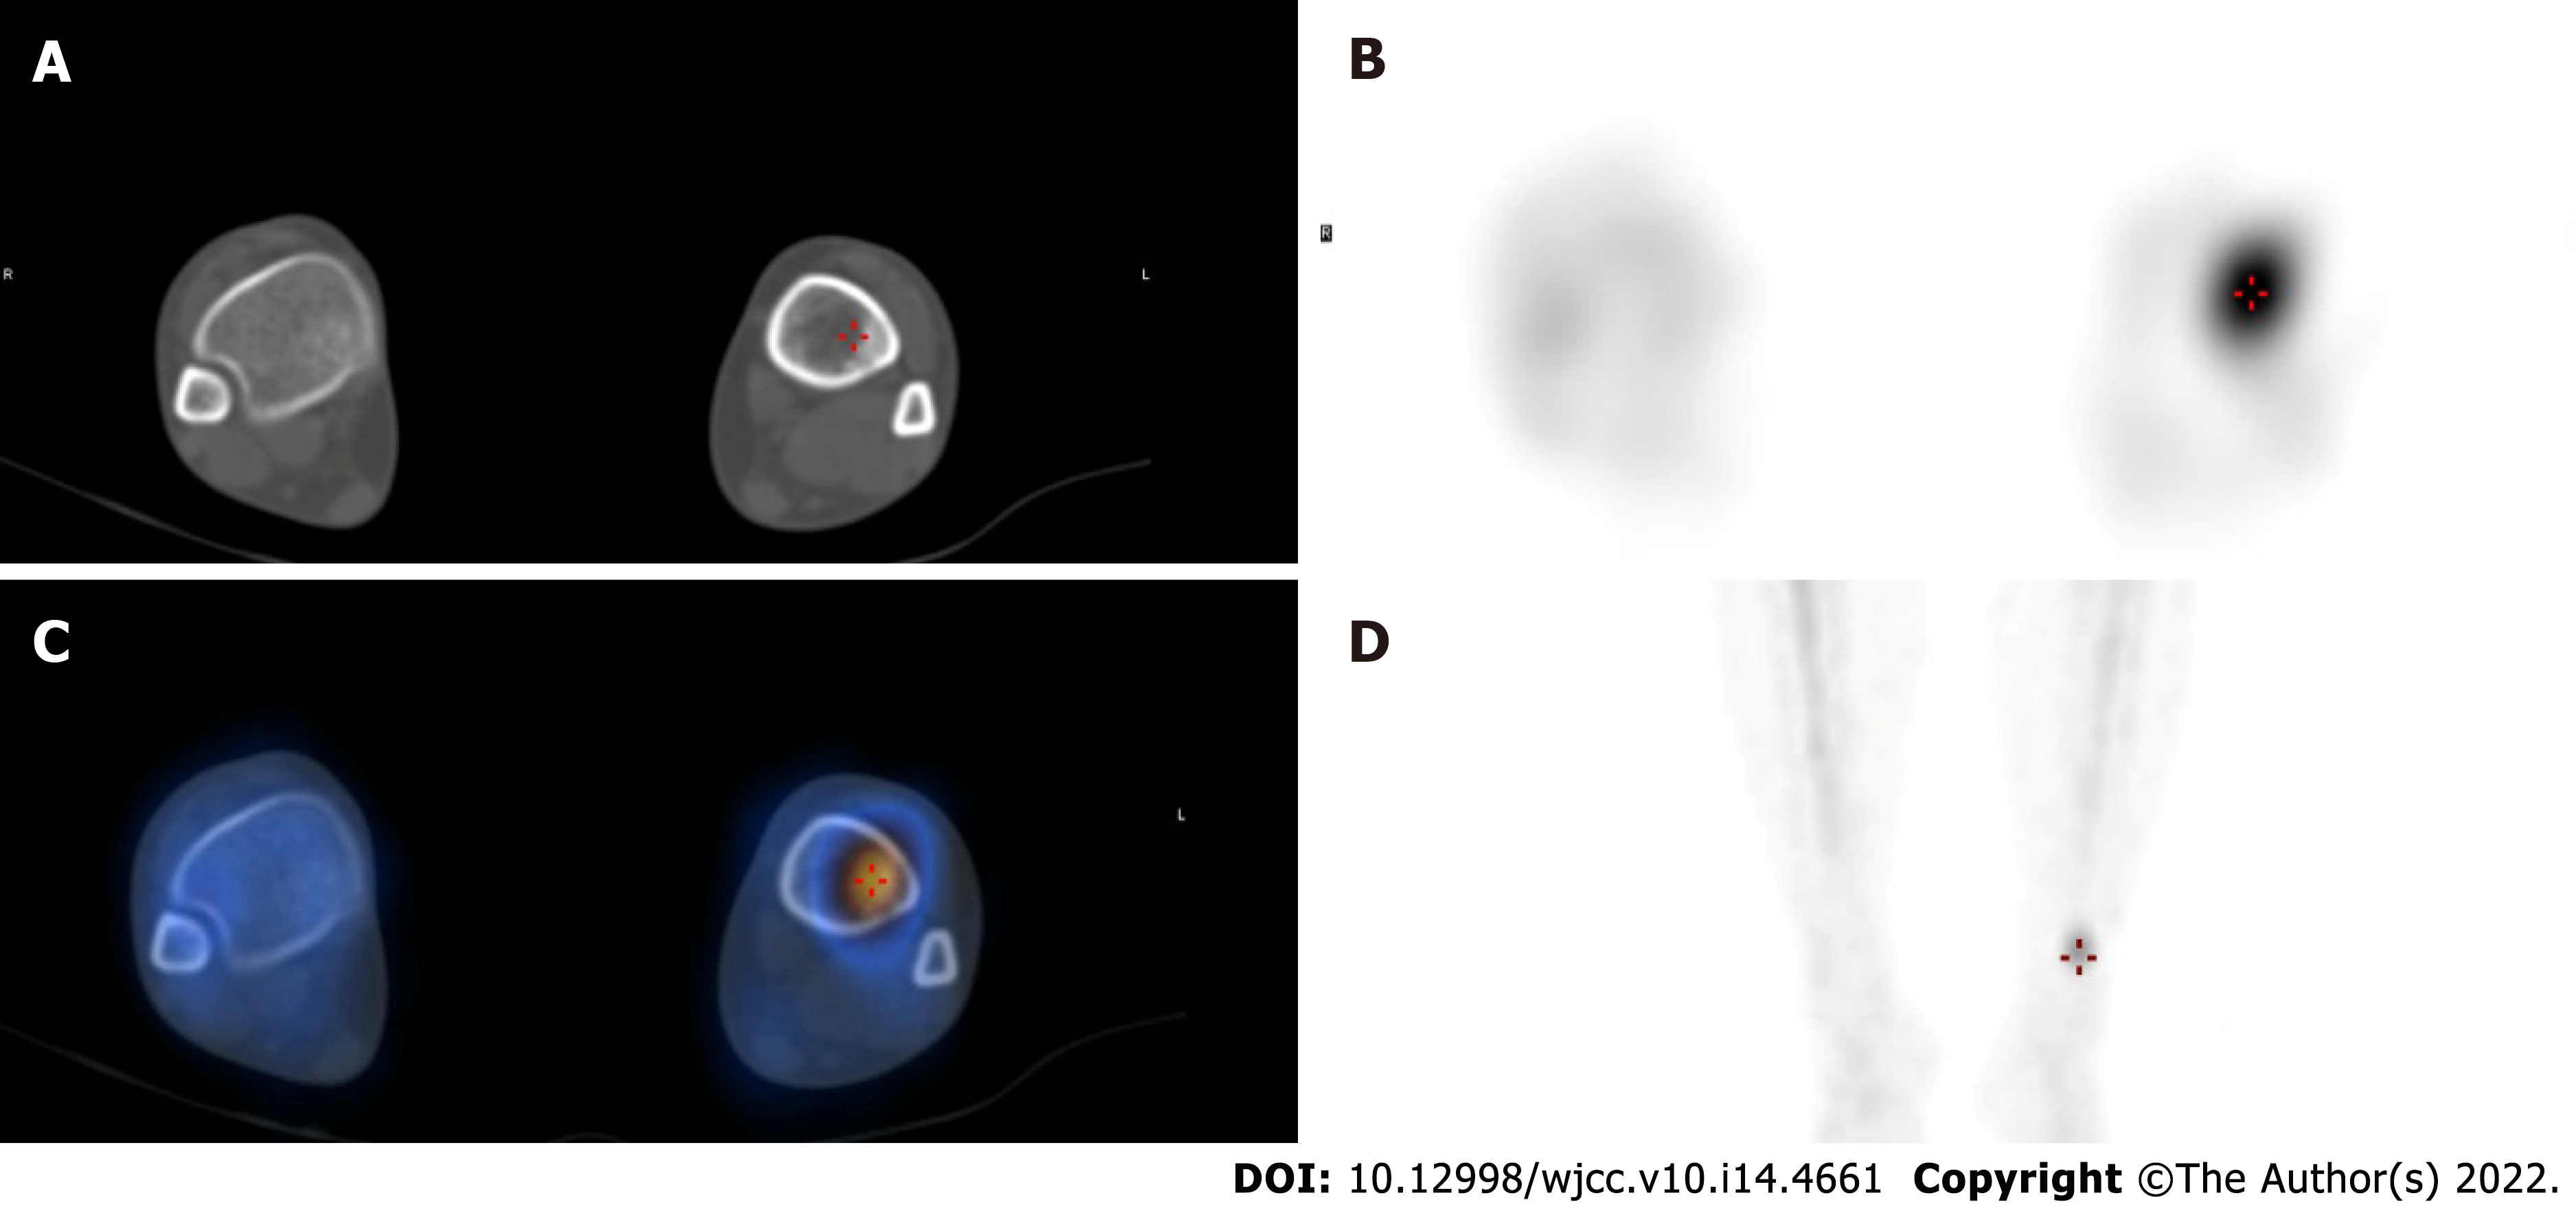
Figure 4 Whole-body bone imaging and organ tomography.
A: Tibial computer tomography; B-D: Radionuclide imaging; C: Radionuclide color imaging.
Figure 5 Postoperative pathology in the left thyroid.
A: Liquid-based cytology of fine-needle aspiration; B: Smear staining of fine-needle puncture. C: HE staining.
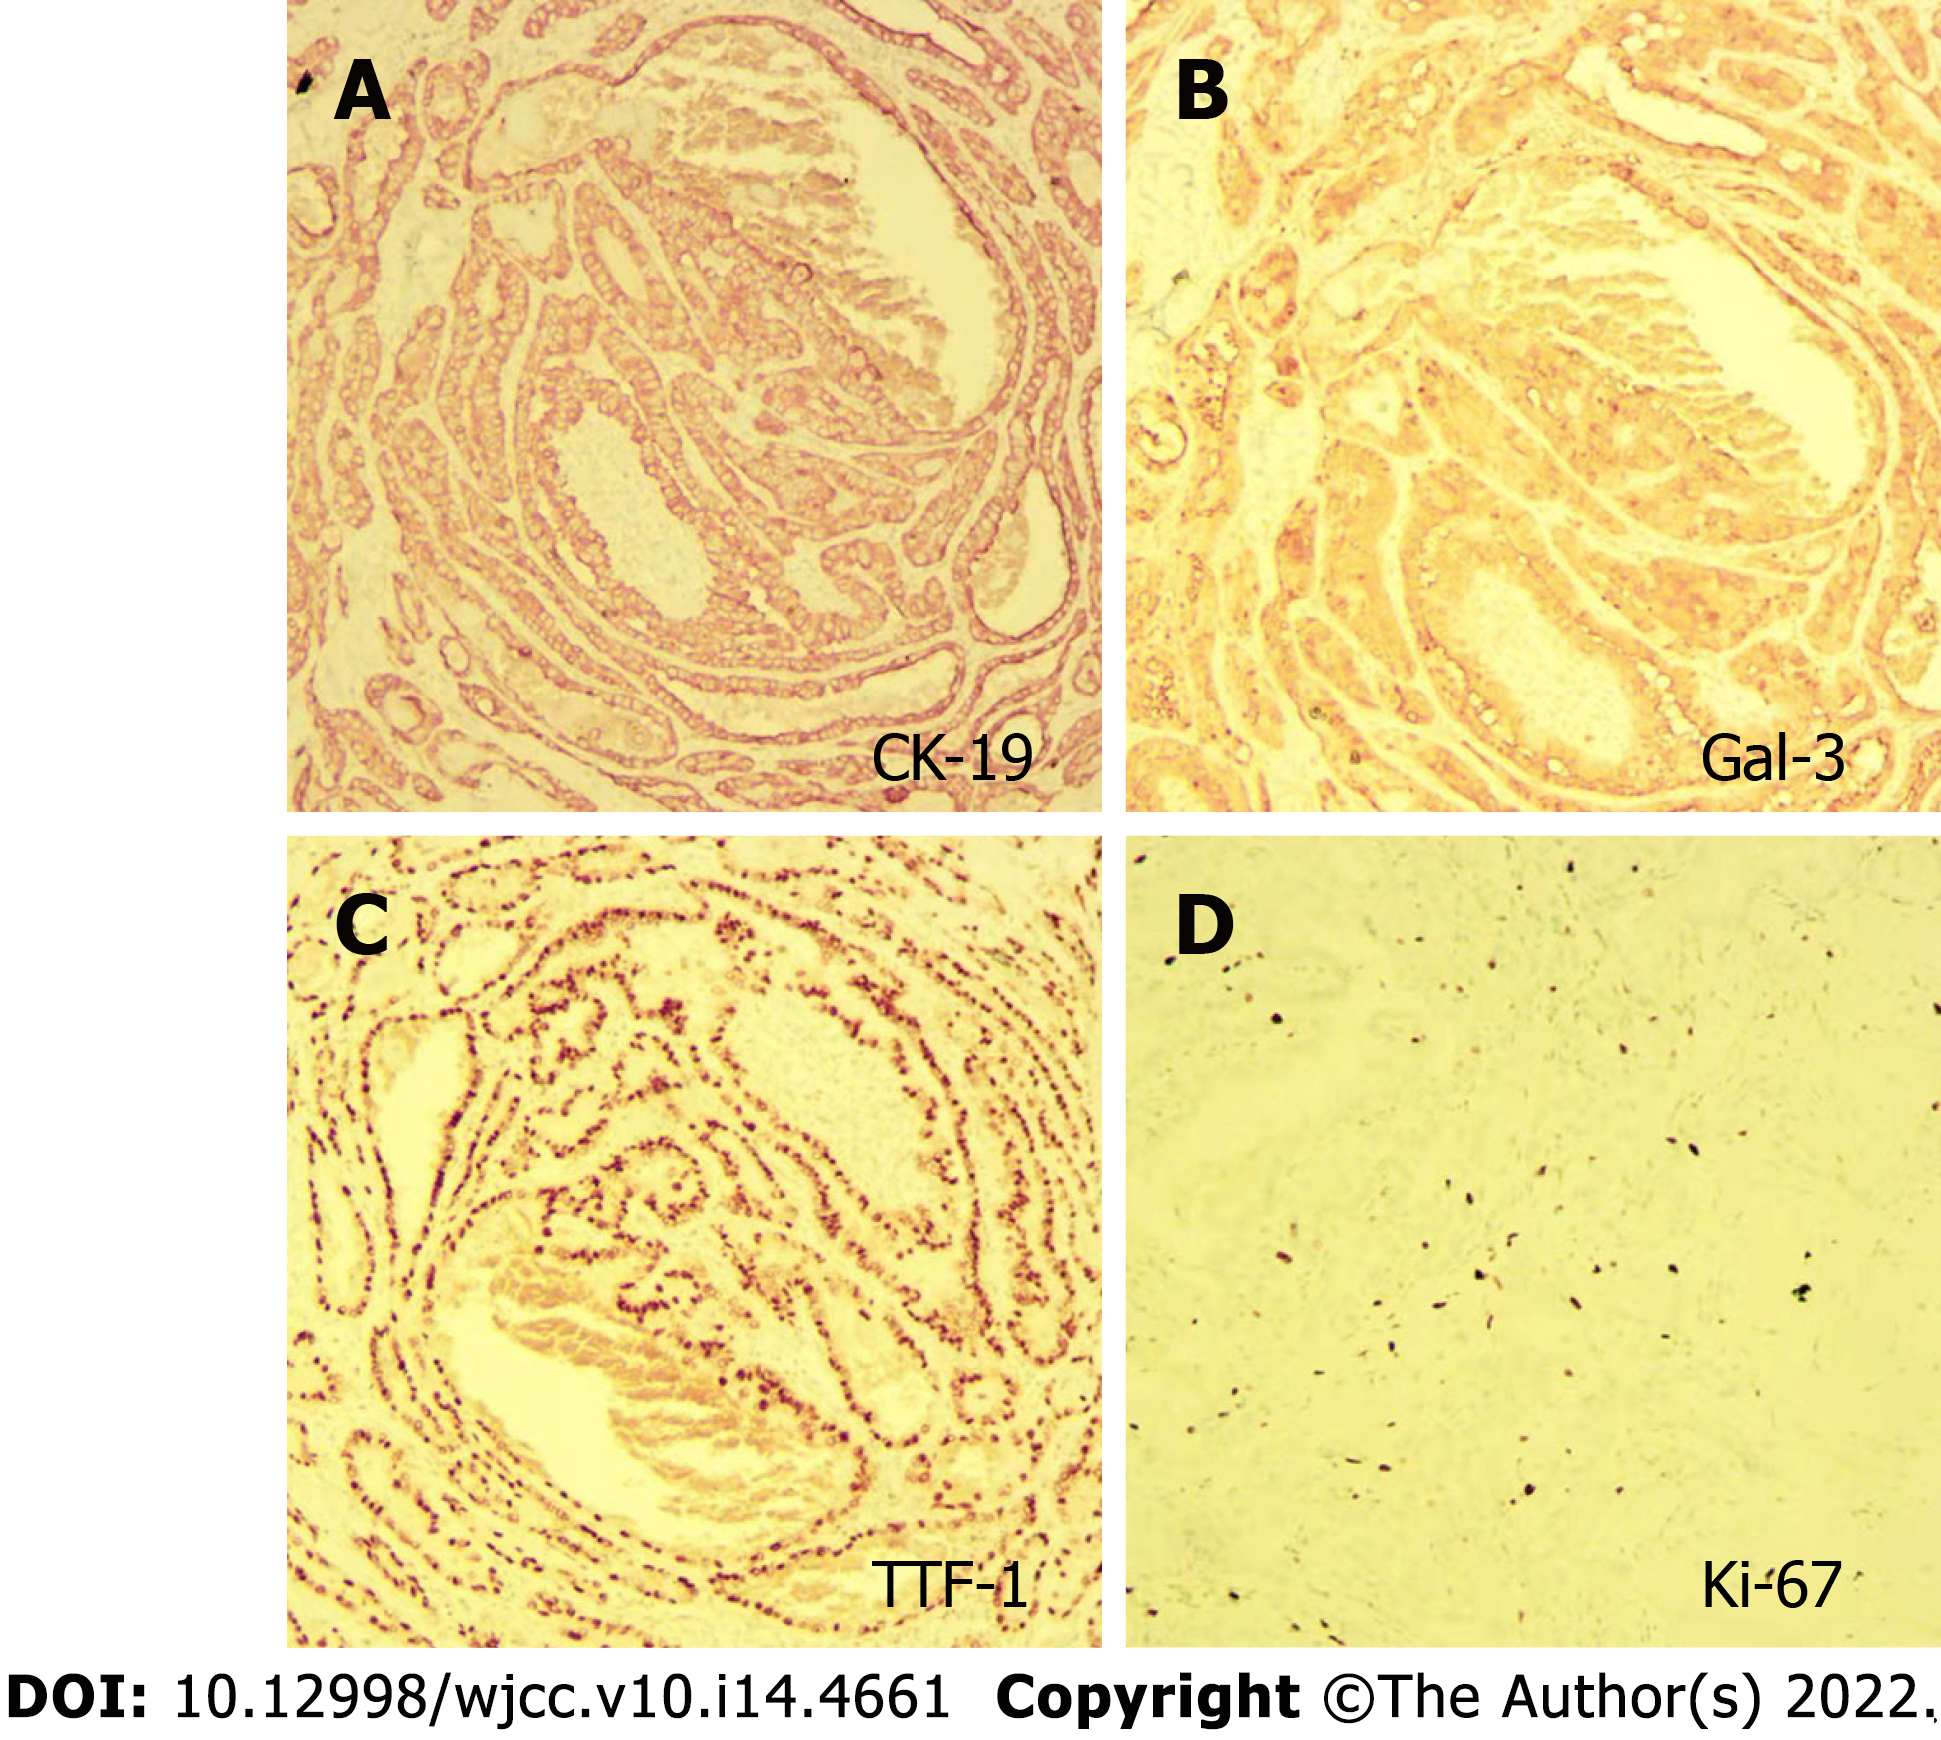
Figure 6 Immunohistochemical staining.
A: CK-19 staining; B: Gal-3 staining; C: TTF-1 staining; D: Ki-67 staining.
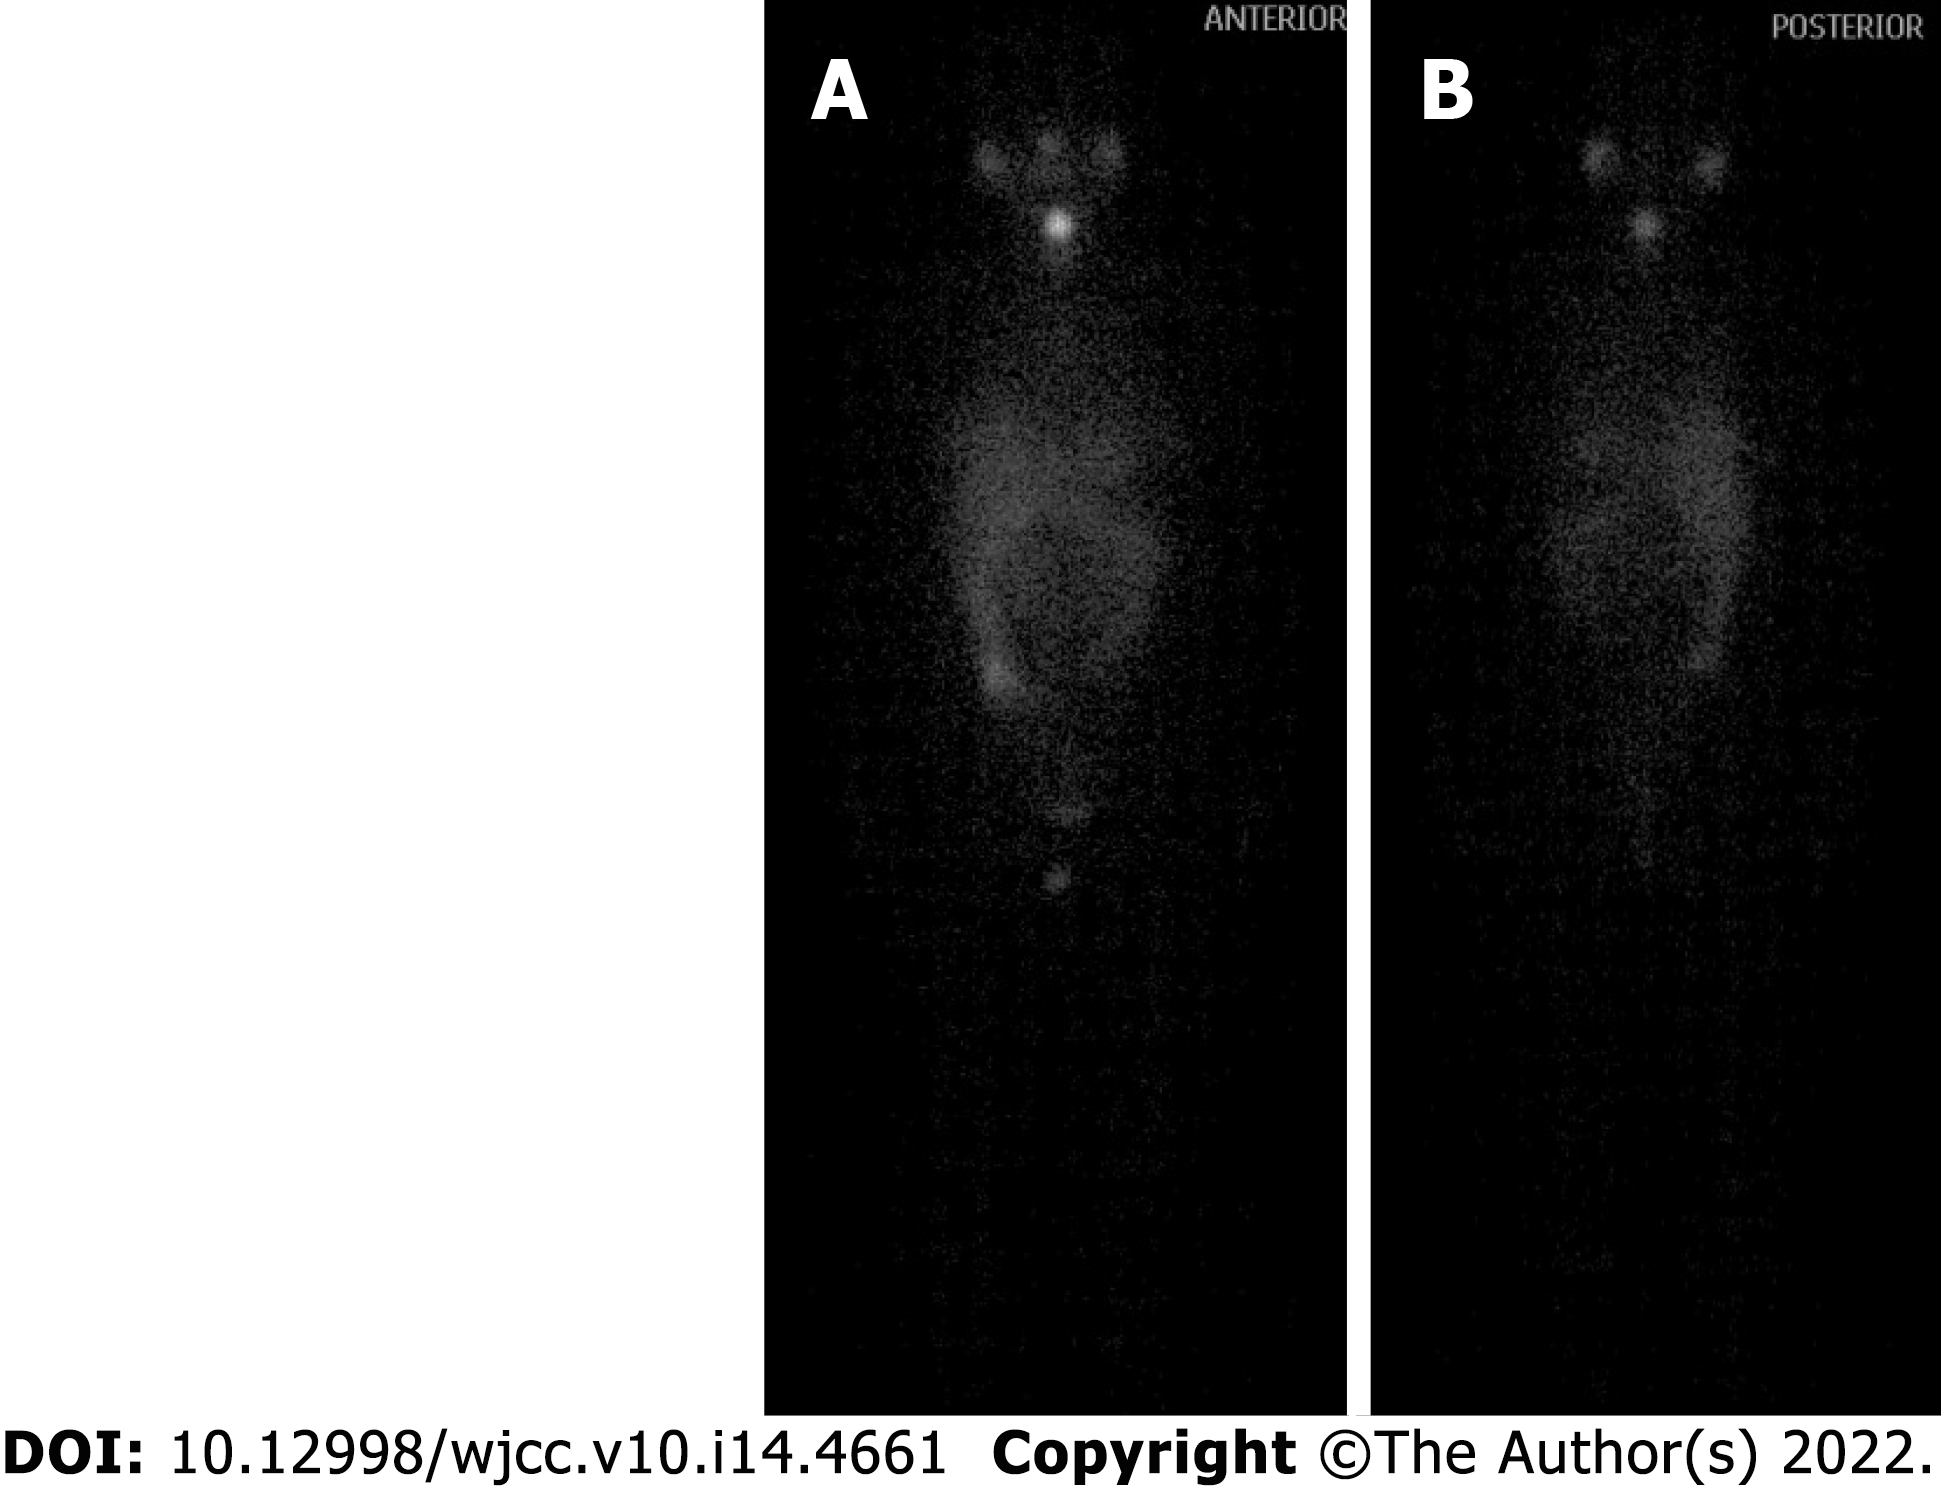
Figure 7 Iodine scan after iodine-131 treatment.
A: Anterior; B: Posterior.
- Citation: Yang CY, Chen XW, Tang D, Yang WJ, Mi XX, Shi JP, Du WD. Hepatopulmonary metastases from papillary thyroid microcarcinoma: A case report. World J Clin Cases 2022; 10(14): 4661-4668
- URL: https://www.wjgnet.com/2307-8960/full/v10/i14/4661.htm
- DOI: https://dx.doi.org/10.12998/wjcc.v10.i14.4661


