Copyright
©The Author(s) 2022.
World J Clin Cases. May 16, 2022; 10(14): 4380-4394
Published online May 16, 2022. doi: 10.12998/wjcc.v10.i14.4380
Published online May 16, 2022. doi: 10.12998/wjcc.v10.i14.4380
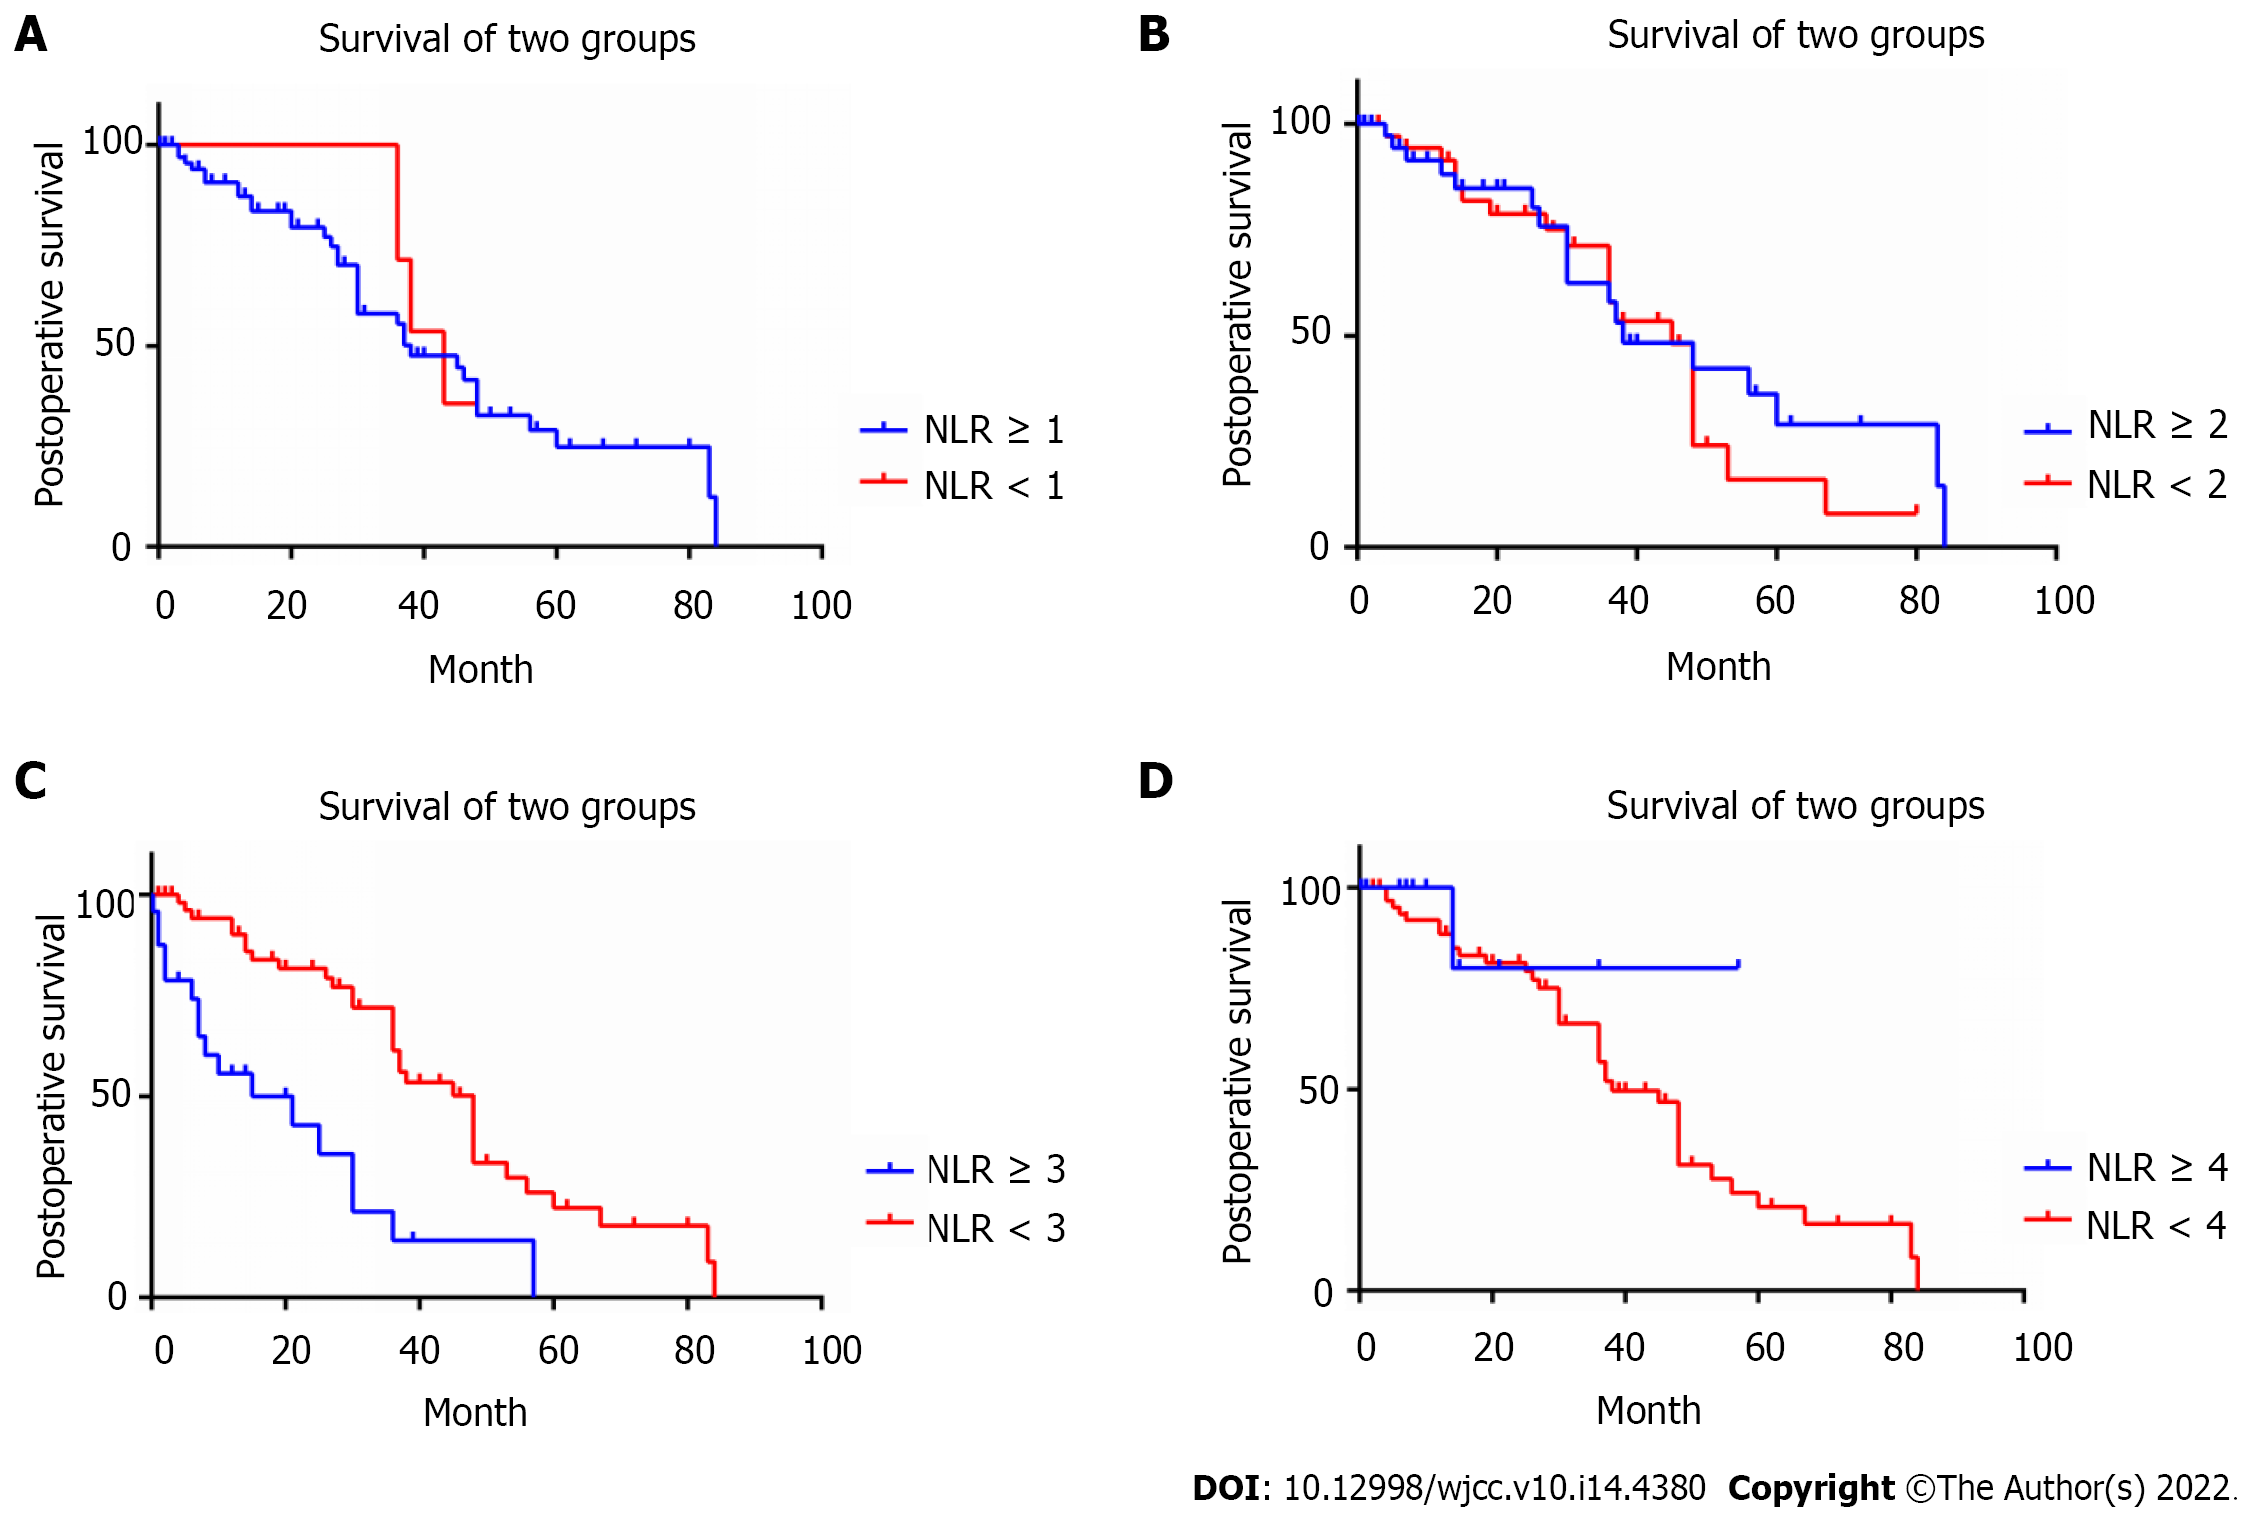
Figure 1 Comparison of survival time of different neutrophil-lymphocyte ratio groups.
A: Comparison of postoperative survival (POS) in patients within the neutrophil-lymphocyte ratio (NLR ≥ 1) group and NLR < 1 group, among which the POS of patients in the NLR ≥ 1 group and the NLR < 1 group showed no significant difference (P > 0.05); B: The POS of patients in the preoperative peripheral blood NLR ≥ 2 group and the NLR < 2 group showed no significant difference (P > 0.05); C: The POS of patients in the preoperative peripheral blood NLR < 3 group was significantly longer than that in the NLR ≥ 3 group (P < 0.05); D: The POS of patients in the preoperative peripheral blood NLR < 4 group was significantly longer than that in the NLR ≥ 4 group (P < 0.05). NLR: Neutrophil-lymphocyte ratio.
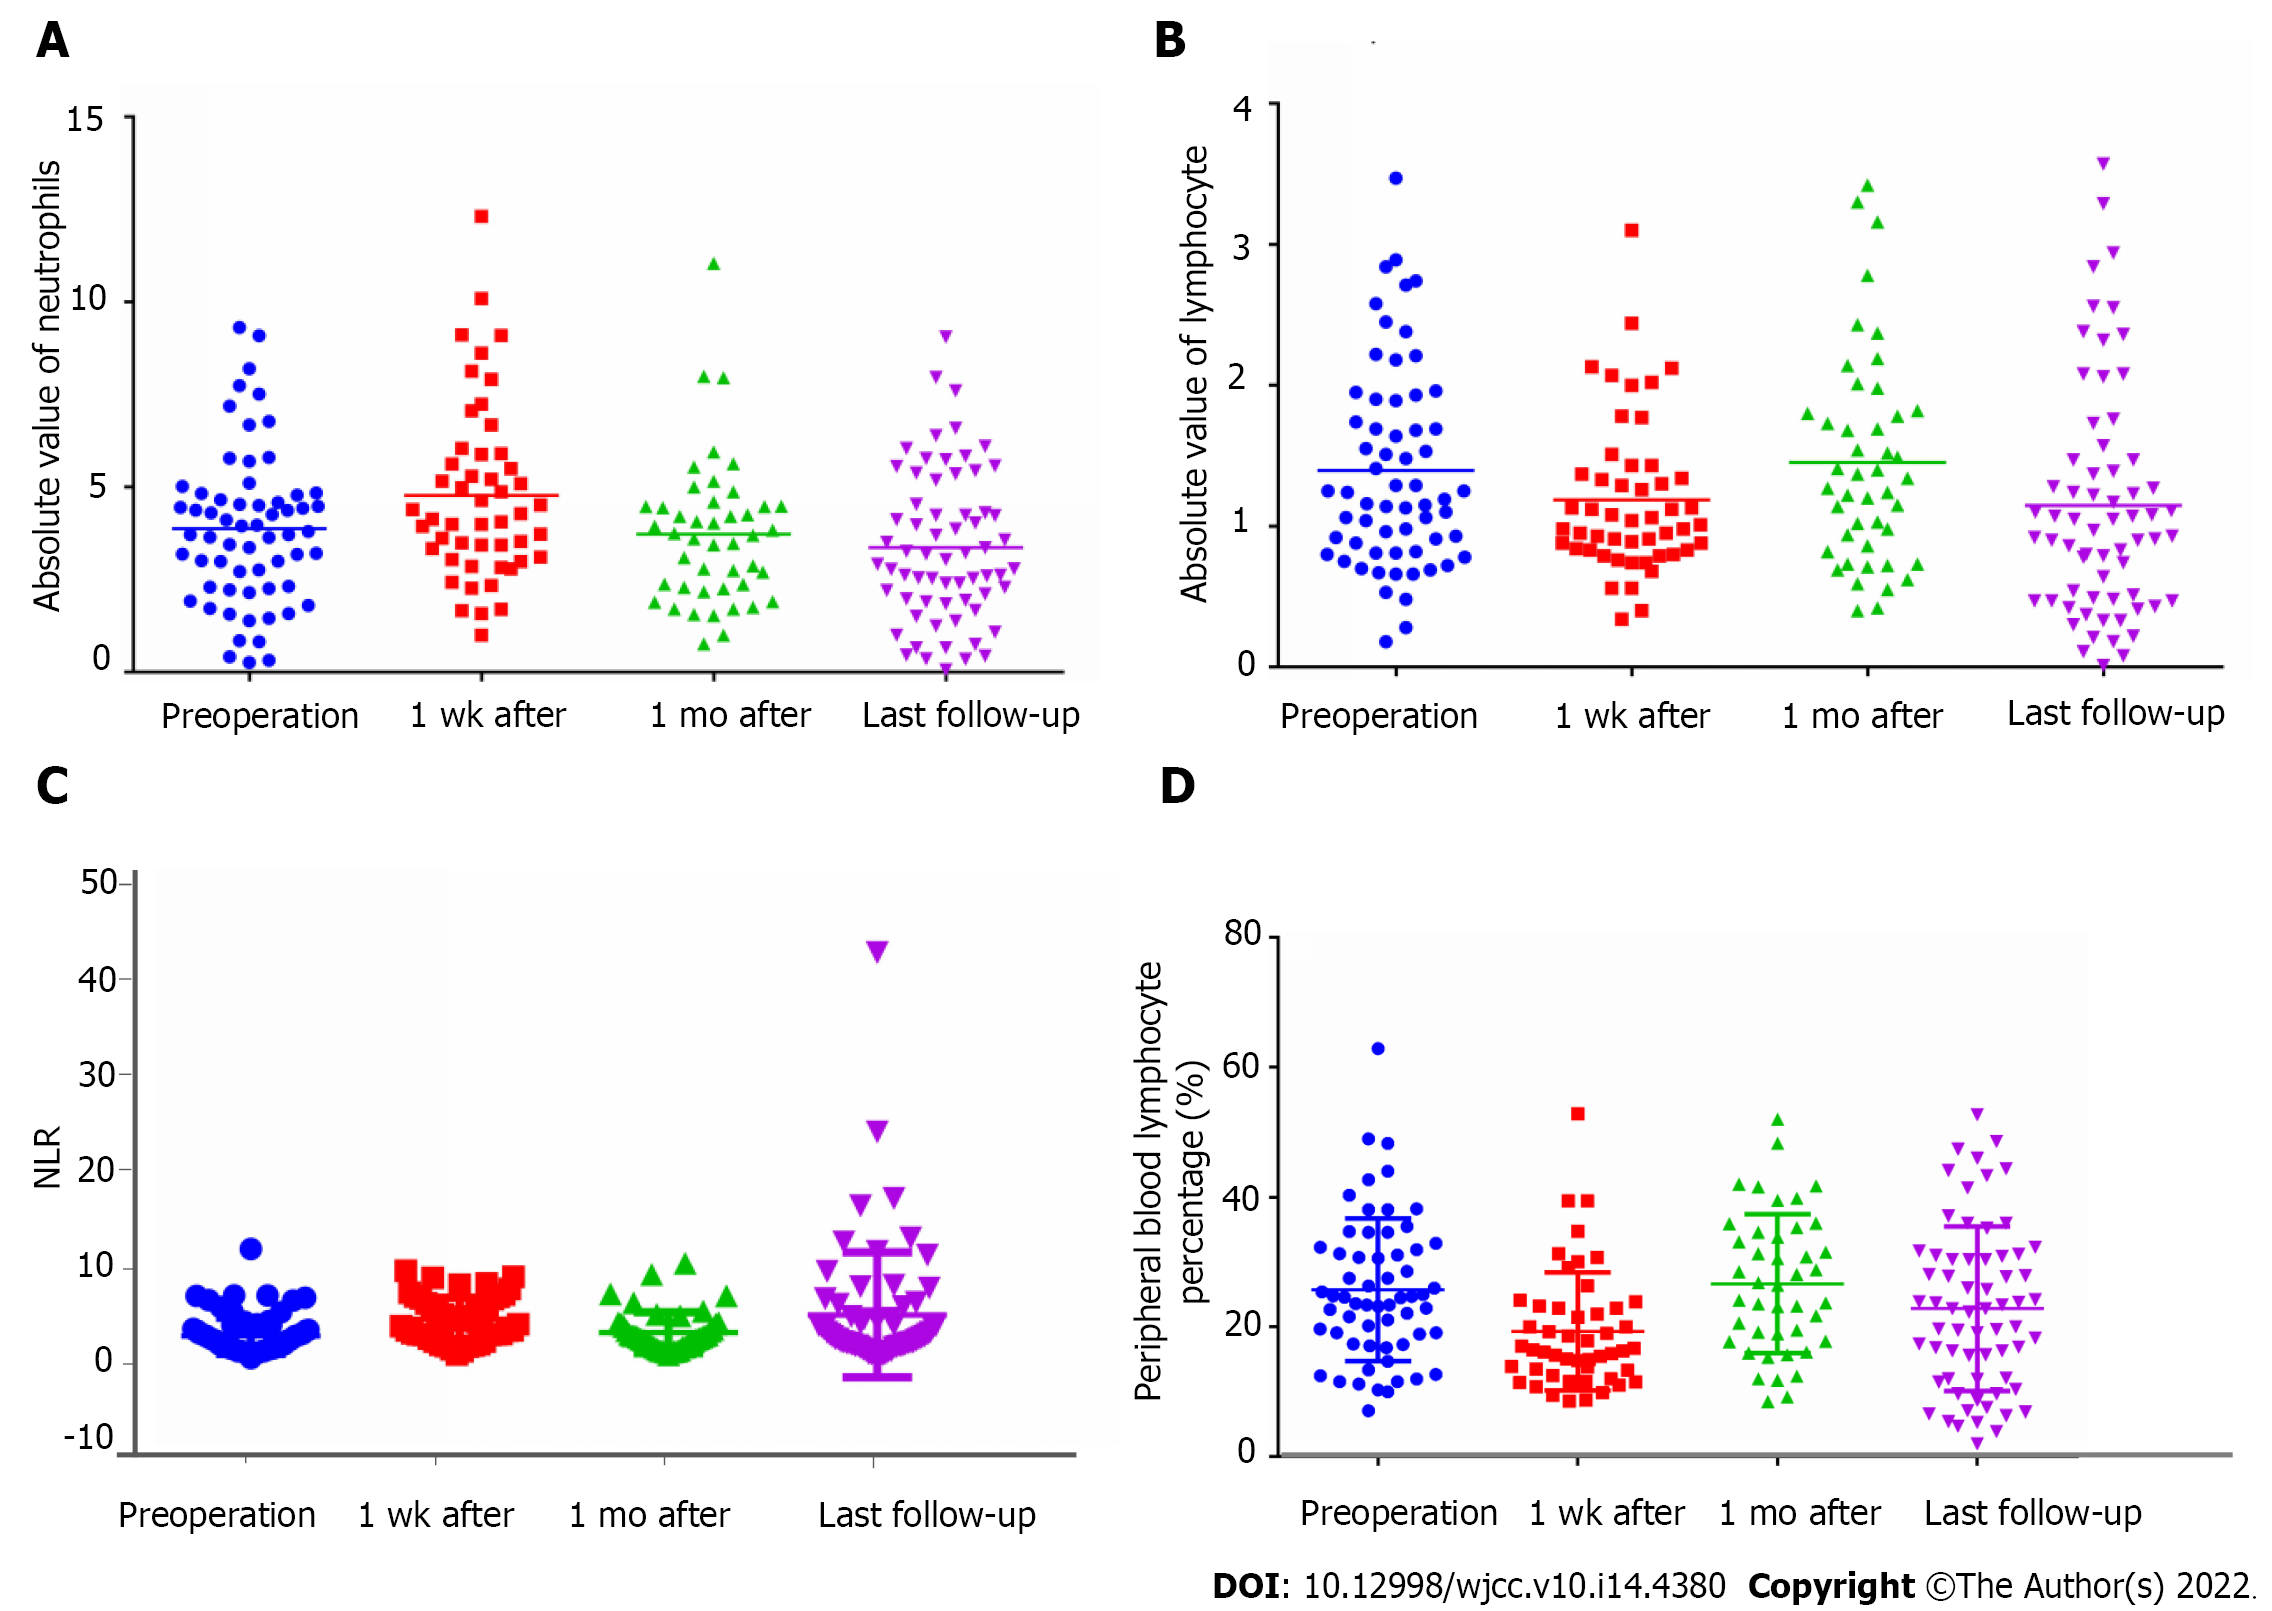
Figure 2 Comparison of white blood cell count or ratio between preoperation, 1 wk after the operation, 1 mo after the operation and the last follow-up visit in multiple myeloma bone disease patients.
A: The absolute neutrophil count increased significantly 1 wk after the operation and returned to that before the operation 1 mo after the operation; B: The peripheral blood absolute lymphocyte count declined after the operation, returned to that before the operation 1 mo after the operation, and returned to a low level at the last follow-up visit; C: Peripheral blood neutrophil-lymphocyte ratio; D: Lymphocyte percentage. NLR: Neutrophil-lymphocyte ratio.
- Citation: Xu ZY, Yao XC, Shi XJ, Du XR. Significance of preoperative peripheral blood neutrophil-lymphocyte ratio in predicting postoperative survival in patients with multiple myeloma bone disease. World J Clin Cases 2022; 10(14): 4380-4394
- URL: https://www.wjgnet.com/2307-8960/full/v10/i14/4380.htm
- DOI: https://dx.doi.org/10.12998/wjcc.v10.i14.4380


