Copyright
©The Author(s) 2018.
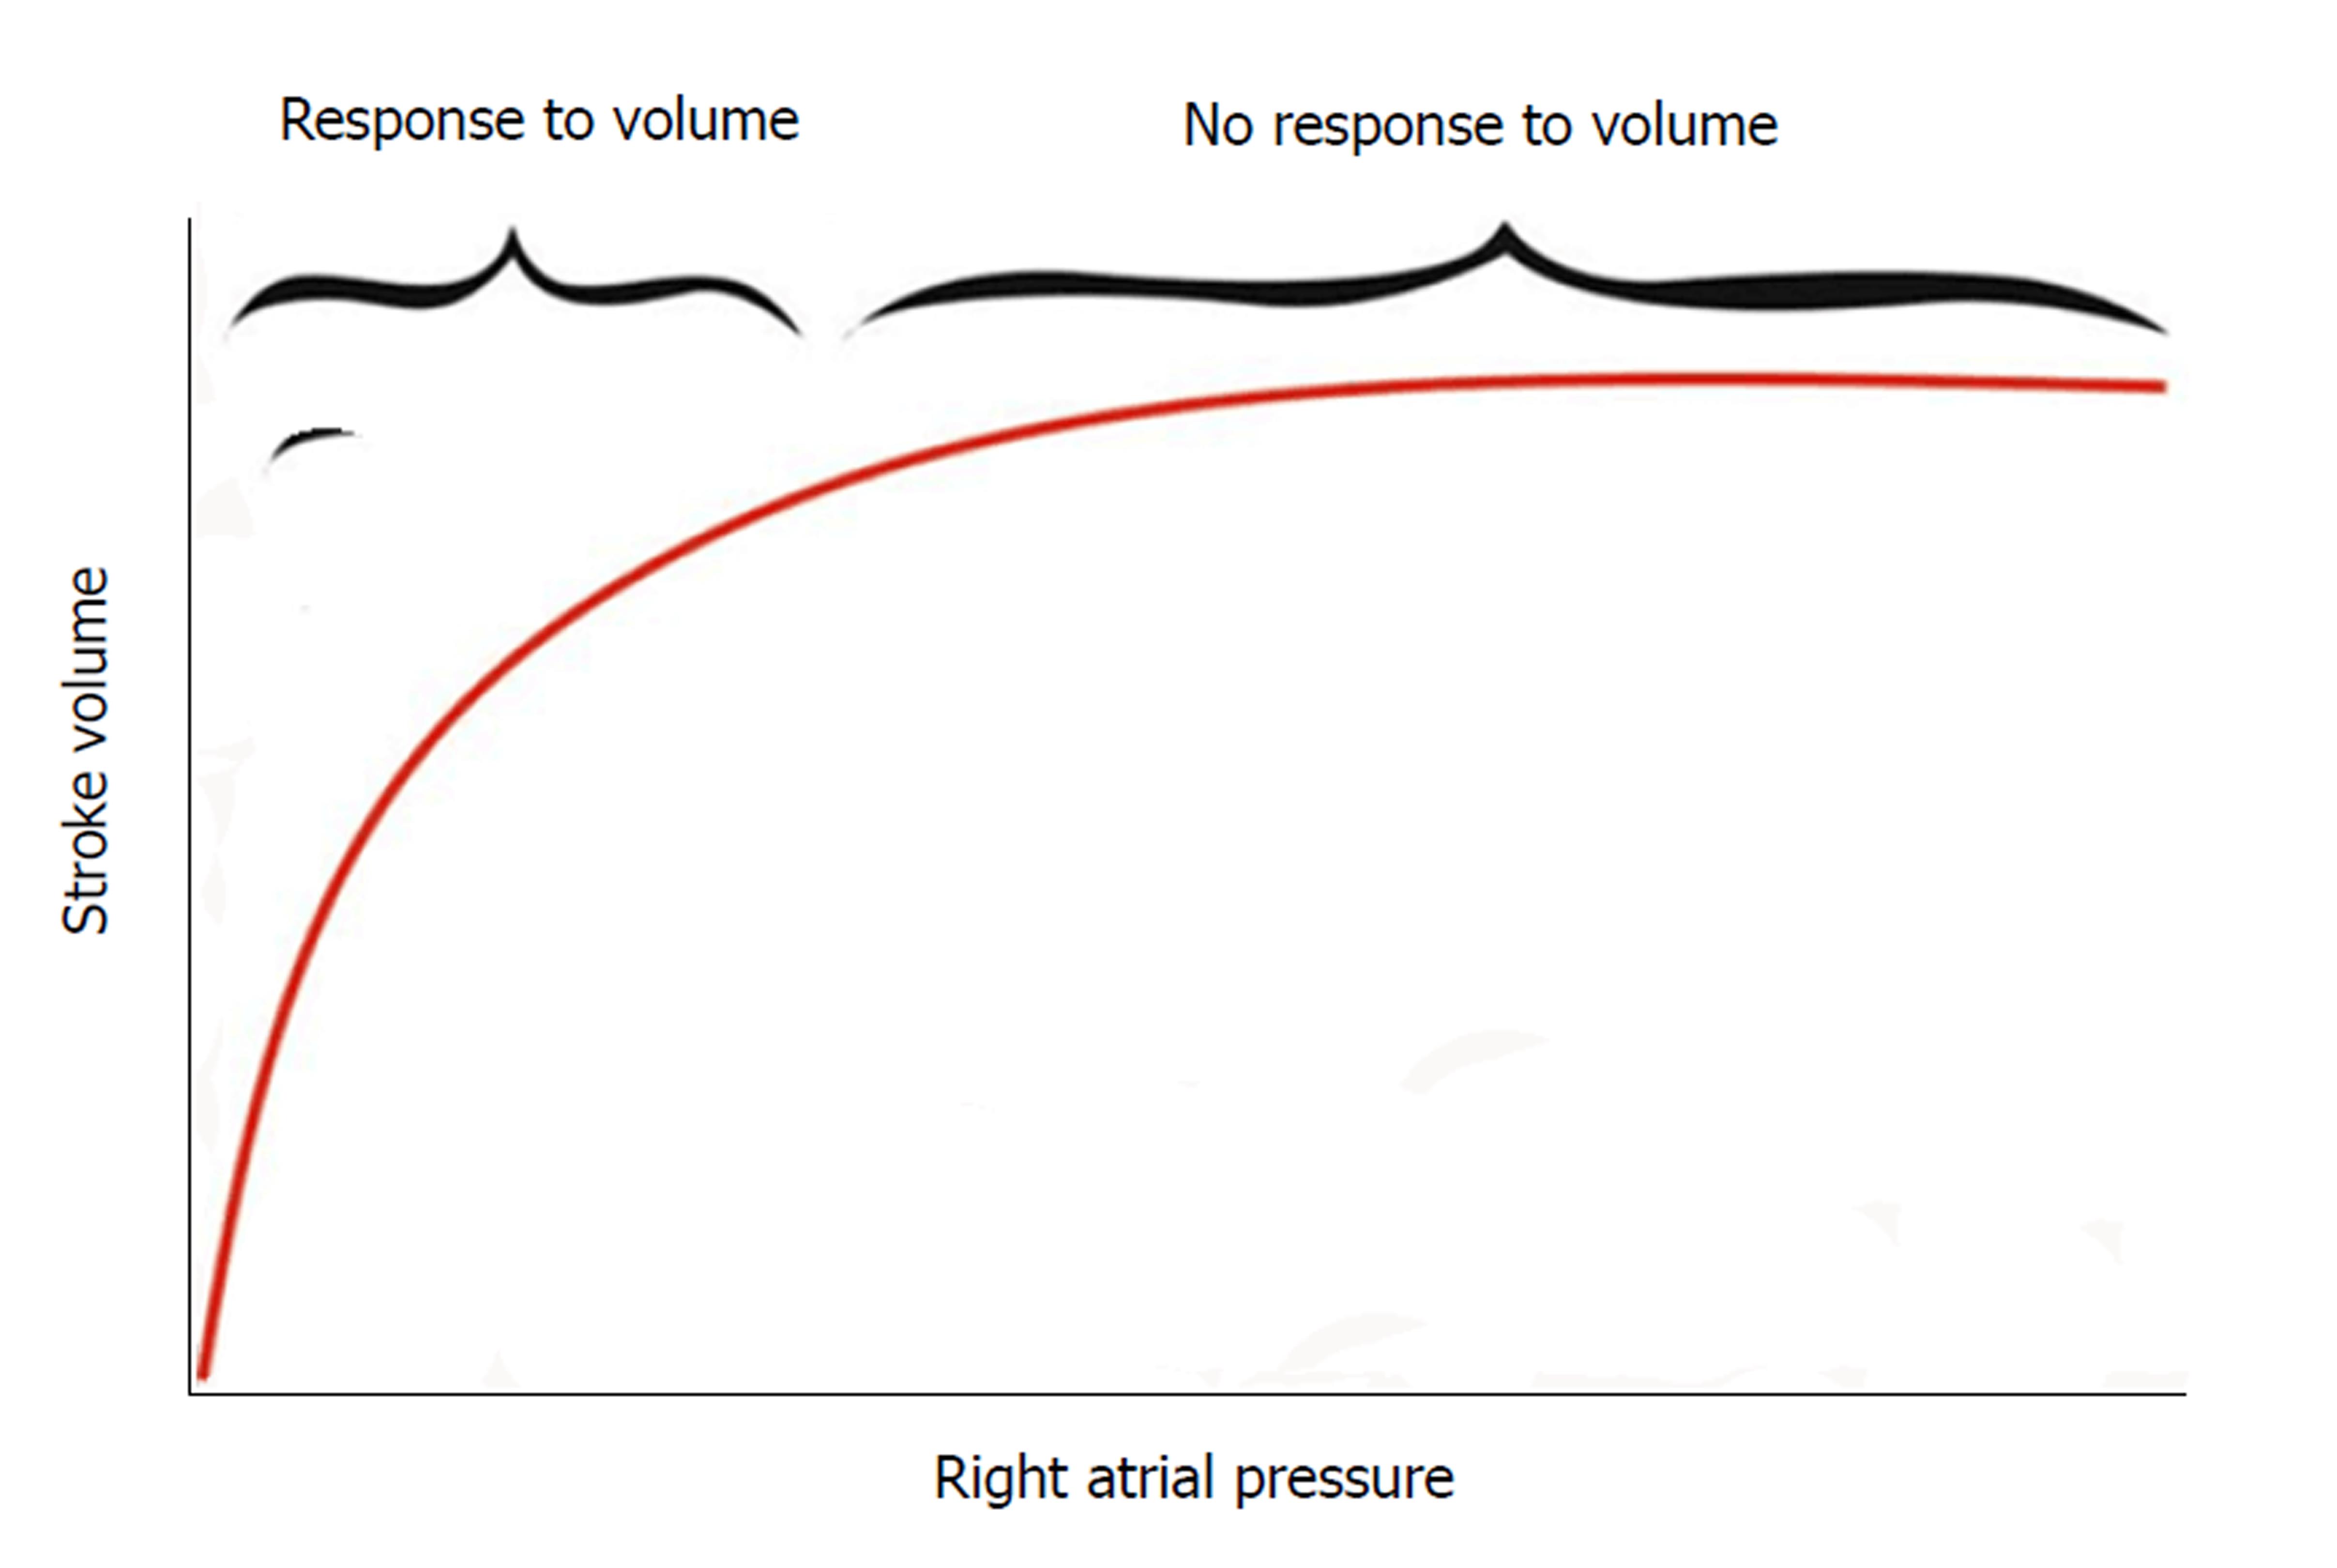
Figure 2 Frank-Starling curve depicting the relation between preload (right atrial pressure) and stroke volume.
At the the steep limb of the curve, there is improvement of stroke volume in response to fluid boluses while there is no more response to the fluid boluses at the flat limb of the curve.
- Citation: Fathi EM, Narchi H, Chedid F. Noninvasive hemodynamic monitoring of septic shock in children. World J Methodol 2018; 8(1): 1-8
- URL: https://www.wjgnet.com/2222-0682/full/v8/i1/1.htm
- DOI: https://dx.doi.org/10.5662/wjm.v8.i1.1


