Copyright
©The Author(s) 2017.
World J Methodol. Sep 26, 2017; 7(3): 73-92
Published online Sep 26, 2017. doi: 10.5662/wjm.v7.i3.73
Published online Sep 26, 2017. doi: 10.5662/wjm.v7.i3.73
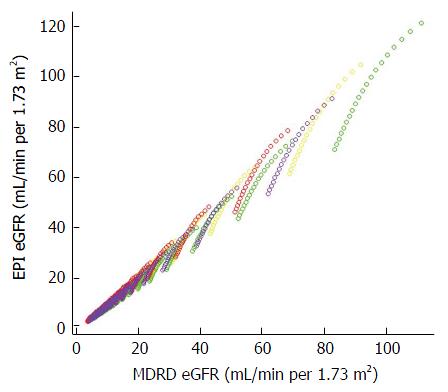
Figure 3 Scatterplot demonstrating close relationships between estimating glomerular filtration rate values calculated by the Chronic Kidney Disease Epidemiology Collaboration formula[23] (Y axis) and the Modification of Diet in Renal Disease formula[22] (X axis).
Different colors are used to indicate the races and genders depicted in this figure: Yellow indicates Caucasian males, Green Black males, Red Caucasian females, and Purple Black females. A straight line to fit the data minimizes the least square error with an intercept of -1.03 and a beta coefficient of 1.04 achieving an R2 value of 0.99. MDRD: Modification of Diet in Renal Disease; CKD-EPI: Chronic Kidney Disease Epidemiology Collaboration; eGFR: Estimating glomerular filtration rate.
- Citation: Alaini A, Malhotra D, Rondon-Berrios H, Argyropoulos CP, Khitan ZJ, Raj DSC, Rohrscheib M, Shapiro JI, Tzamaloukas AH. Establishing the presence or absence of chronic kidney disease: Uses and limitations of formulas estimating the glomerular filtration rate. World J Methodol 2017; 7(3): 73-92
- URL: https://www.wjgnet.com/2222-0682/full/v7/i3/73.htm
- DOI: https://dx.doi.org/10.5662/wjm.v7.i3.73


