Copyright
©2014 Baishideng Publishing Group Inc.
World J Methodol. Jun 26, 2014; 4(2): 109-122
Published online Jun 26, 2014. doi: 10.5662/wjm.v4.i2.109
Published online Jun 26, 2014. doi: 10.5662/wjm.v4.i2.109
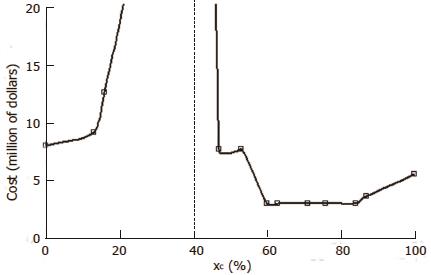
Figure 9 Cost estimates in a realistic test data set for targeted drug therapy of lung cancer, presented in Tables 2 and 3.
Cost constants in thousands of dollars are as follows: screening cost per case c1 = 1, treatment cost c2 = 10, opportunity cost c3 = 100/year, case rate r = 50/year, follow up time t =1 year. Cost to the right of the dashed vertical asymptote are for a significant positive result (experimental treatment better than control). Costs to the left of the dashed vertical asymptote are for a significant negative result (experimental treatment worse than control).
- Citation: Babbs CF. Choosing inclusion criteria that minimize the time and cost of clinical trials. World J Methodol 2014; 4(2): 109-122
- URL: https://www.wjgnet.com/2222-0682/full/v4/i2/109.htm
- DOI: https://dx.doi.org/10.5662/wjm.v4.i2.109


