Copyright
©2014 Baishideng Publishing Group Inc.
World J Methodol. Jun 26, 2014; 4(2): 109-122
Published online Jun 26, 2014. doi: 10.5662/wjm.v4.i2.109
Published online Jun 26, 2014. doi: 10.5662/wjm.v4.i2.109
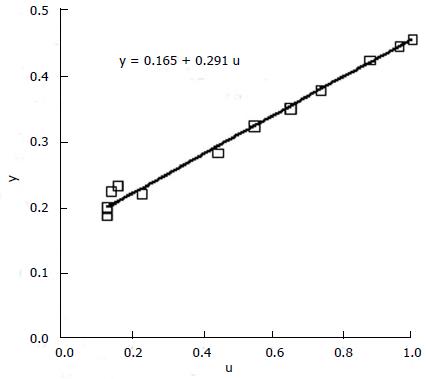
Figure 8 Regression analysis on the last two columns of Table 3.
A plot of the hybrid variable, y = pC(u)(π + u), vs u can be used to evaluate model parameters π3 and π4. The slope of the regression line is π4, and the intercept divided by π is π3.
- Citation: Babbs CF. Choosing inclusion criteria that minimize the time and cost of clinical trials. World J Methodol 2014; 4(2): 109-122
- URL: https://www.wjgnet.com/2222-0682/full/v4/i2/109.htm
- DOI: https://dx.doi.org/10.5662/wjm.v4.i2.109


