Copyright
©2014 Baishideng Publishing Group Inc.
World J Methodol. Jun 26, 2014; 4(2): 109-122
Published online Jun 26, 2014. doi: 10.5662/wjm.v4.i2.109
Published online Jun 26, 2014. doi: 10.5662/wjm.v4.i2.109
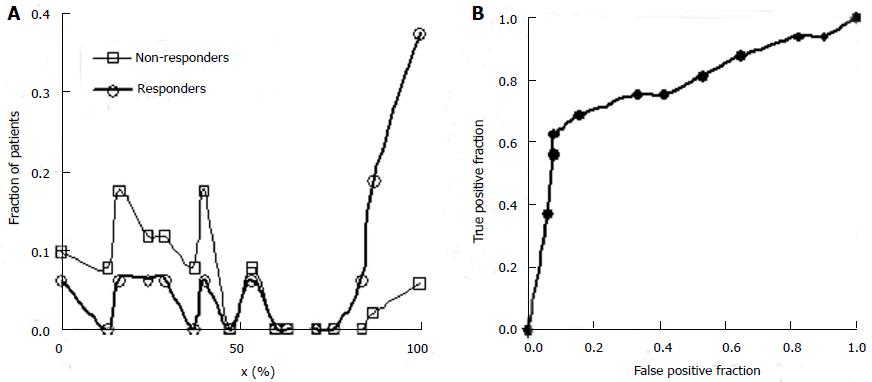
Figure 7 Fraction of patients.
A: Separation of observed responders and non-responders to the experimental treatment along the x-domain in this reconstructed preliminary study. The fraction of patients with each x-value is show on the vertical axis. Patients with x-scores over 60% have a much greater likelihood of responding; B: ROC curve for the screening procedure.
- Citation: Babbs CF. Choosing inclusion criteria that minimize the time and cost of clinical trials. World J Methodol 2014; 4(2): 109-122
- URL: https://www.wjgnet.com/2222-0682/full/v4/i2/109.htm
- DOI: https://dx.doi.org/10.5662/wjm.v4.i2.109


