Copyright
©2014 Baishideng Publishing Group Inc.
World J Methodol. Jun 26, 2014; 4(2): 109-122
Published online Jun 26, 2014. doi: 10.5662/wjm.v4.i2.109
Published online Jun 26, 2014. doi: 10.5662/wjm.v4.i2.109
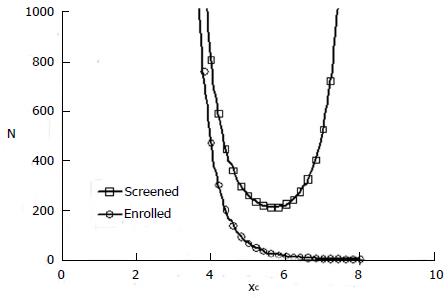
Figure 4 Numbers of patients screened and enrolled in a model study of heterogeneous responders having a statistically significant positive result.
For this model the proportion of type 1, good responders q = 0.2, the response probability for type 1 patients, π1 = 1.0, the response probability for type 2, poor responders, π2 = 0. The response probabilities for both phenotypes to the control treatment, π3 and π4 both equal 0.2. The mean value of the z statistic for the alternative hypothesis is 2.96 (84% power for the trial). The proportion of patients, α, assigned to the experimental group is 0.5.
- Citation: Babbs CF. Choosing inclusion criteria that minimize the time and cost of clinical trials. World J Methodol 2014; 4(2): 109-122
- URL: https://www.wjgnet.com/2222-0682/full/v4/i2/109.htm
- DOI: https://dx.doi.org/10.5662/wjm.v4.i2.109


