Copyright
©2014 Baishideng Publishing Group Inc.
World J Methodol. Jun 26, 2014; 4(2): 109-122
Published online Jun 26, 2014. doi: 10.5662/wjm.v4.i2.109
Published online Jun 26, 2014. doi: 10.5662/wjm.v4.i2.109
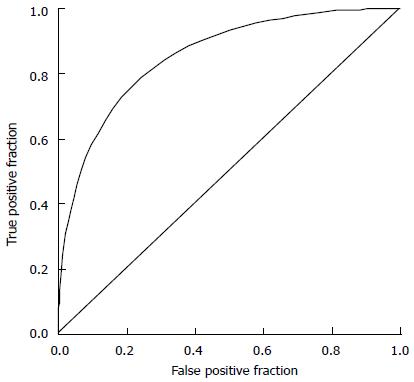
Figure 3 A sample receiver operating characteristic curve for a hypothetical screening test.
In this example type 1 patients had screening scores, x, with a mean of 5.5 and a standard deviation of 1; type 2 patients had screening scores, x, with a mean of 4 and a standard deviation of 1. As the cutoff value xc is swept from 1.0 toward zero, a family of true positive and false positive fractions is created to generate the receiver operating characteristic (ROC) curve.
- Citation: Babbs CF. Choosing inclusion criteria that minimize the time and cost of clinical trials. World J Methodol 2014; 4(2): 109-122
- URL: https://www.wjgnet.com/2222-0682/full/v4/i2/109.htm
- DOI: https://dx.doi.org/10.5662/wjm.v4.i2.109


