Copyright
©2014 Baishideng Publishing Group Inc.
World J Methodol. Jun 26, 2014; 4(2): 109-122
Published online Jun 26, 2014. doi: 10.5662/wjm.v4.i2.109
Published online Jun 26, 2014. doi: 10.5662/wjm.v4.i2.109
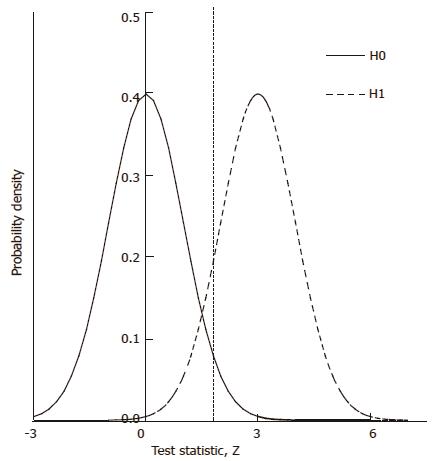
Figure 2 Calculation of power from probability density distributions for the null hypothesis (H0) and for an alternative hypothesis (H1).
The dashed line shows critical value for significance (1.96 for two-tailed P < 0.05). The area under the thick curve to the right of the critical value is the statistical power of the test of H0.
- Citation: Babbs CF. Choosing inclusion criteria that minimize the time and cost of clinical trials. World J Methodol 2014; 4(2): 109-122
- URL: https://www.wjgnet.com/2222-0682/full/v4/i2/109.htm
- DOI: https://dx.doi.org/10.5662/wjm.v4.i2.109


