Copyright
©2014 Baishideng Publishing Group Inc.
World J Methodol. Jun 26, 2014; 4(2): 109-122
Published online Jun 26, 2014. doi: 10.5662/wjm.v4.i2.109
Published online Jun 26, 2014. doi: 10.5662/wjm.v4.i2.109
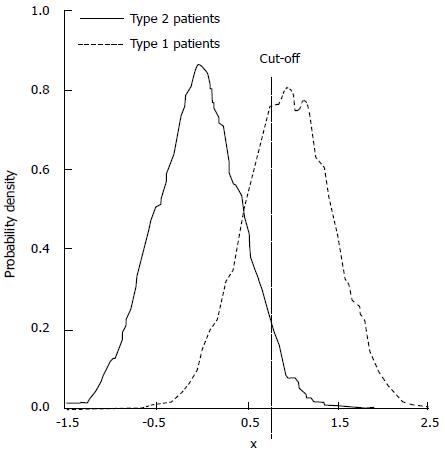
Figure 1 Separation of patient response phenotypes to a tested treatment according to an aggregate predictive variable, x.
The fraction of type 1 responders to the right of the cutoff is the true positive fraction. The fraction of type 2 non-responders to the right of the cutoff is the false positive fraction. In this general example the units of x are arbitrary.
- Citation: Babbs CF. Choosing inclusion criteria that minimize the time and cost of clinical trials. World J Methodol 2014; 4(2): 109-122
- URL: https://www.wjgnet.com/2222-0682/full/v4/i2/109.htm
- DOI: https://dx.doi.org/10.5662/wjm.v4.i2.109


