Copyright
©2012 Baishideng Publishing Group Co.
World J Methodol. Dec 26, 2012; 2(6): 42-49
Published online Dec 26, 2012. doi: 10.5662/wjm.v2.i6.42
Published online Dec 26, 2012. doi: 10.5662/wjm.v2.i6.42
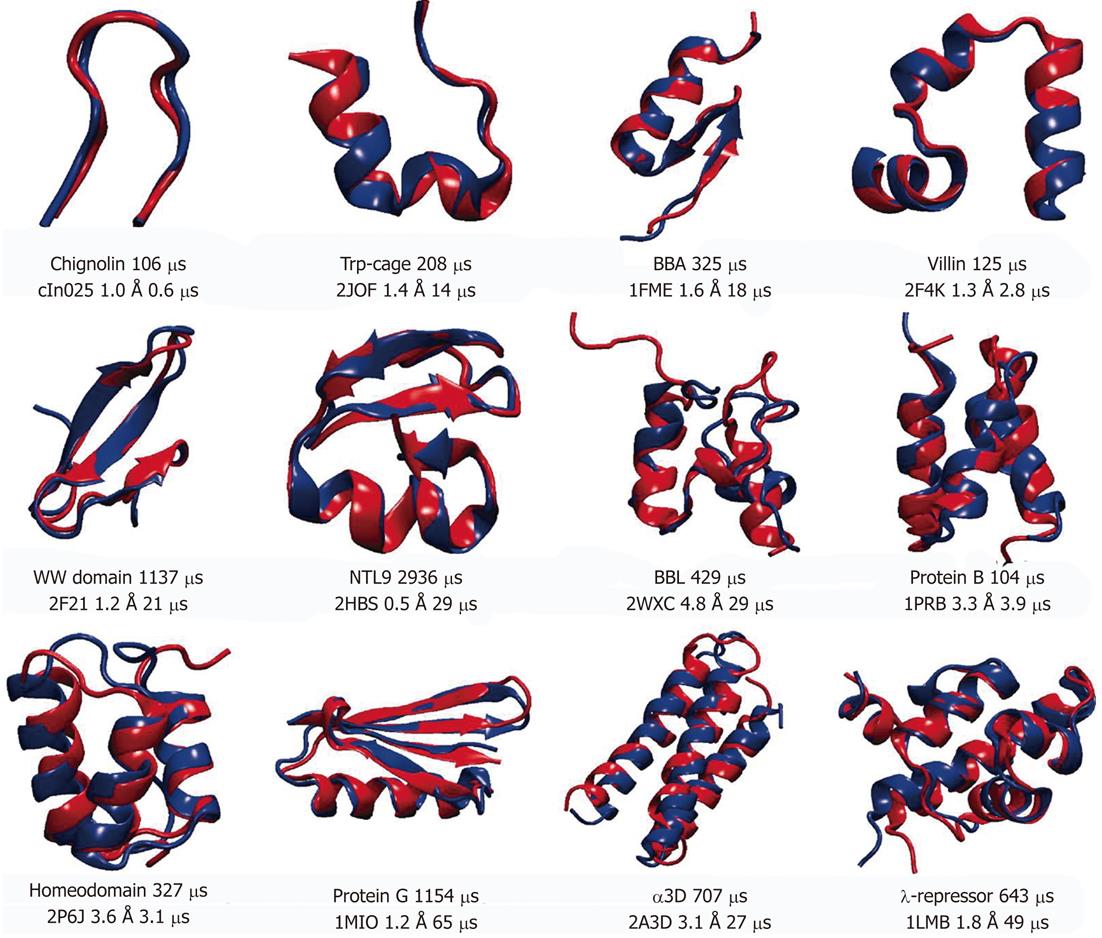
Figure 3 Representative structures of 12 proteins used in molecular dynamics simulation studies[42].
Experimentally determined structures are shown in red and superimposed onto the structures obtained from molecular dynamics simulations (shown in blue). Protein Databank (PDB) entry, root mean square deviations of Cα atoms between two structures and simulation times (total and needed for folding) are displayed for each protein under the superimposed structures. For Protein G the PDB entry was used for the closest homolog, since the structure for the simulated sequence has not been solved experimentally. Reproduced with permission (Copyright 2011, Science publishing group).
-
Citation: Guliaev AB, Cheng S, Hang B. Protein dynamics
via computational microscope. World J Methodol 2012; 2(6): 42-49 - URL: https://www.wjgnet.com/2222-0682/full/v2/i6/42.htm
- DOI: https://dx.doi.org/10.5662/wjm.v2.i6.42


