Copyright
©2012 Baishideng.
World J Methodol. Oct 26, 2012; 2(5): 33-41
Published online Oct 26, 2012. doi: 10.5662/wjm.v2.i5.33
Published online Oct 26, 2012. doi: 10.5662/wjm.v2.i5.33
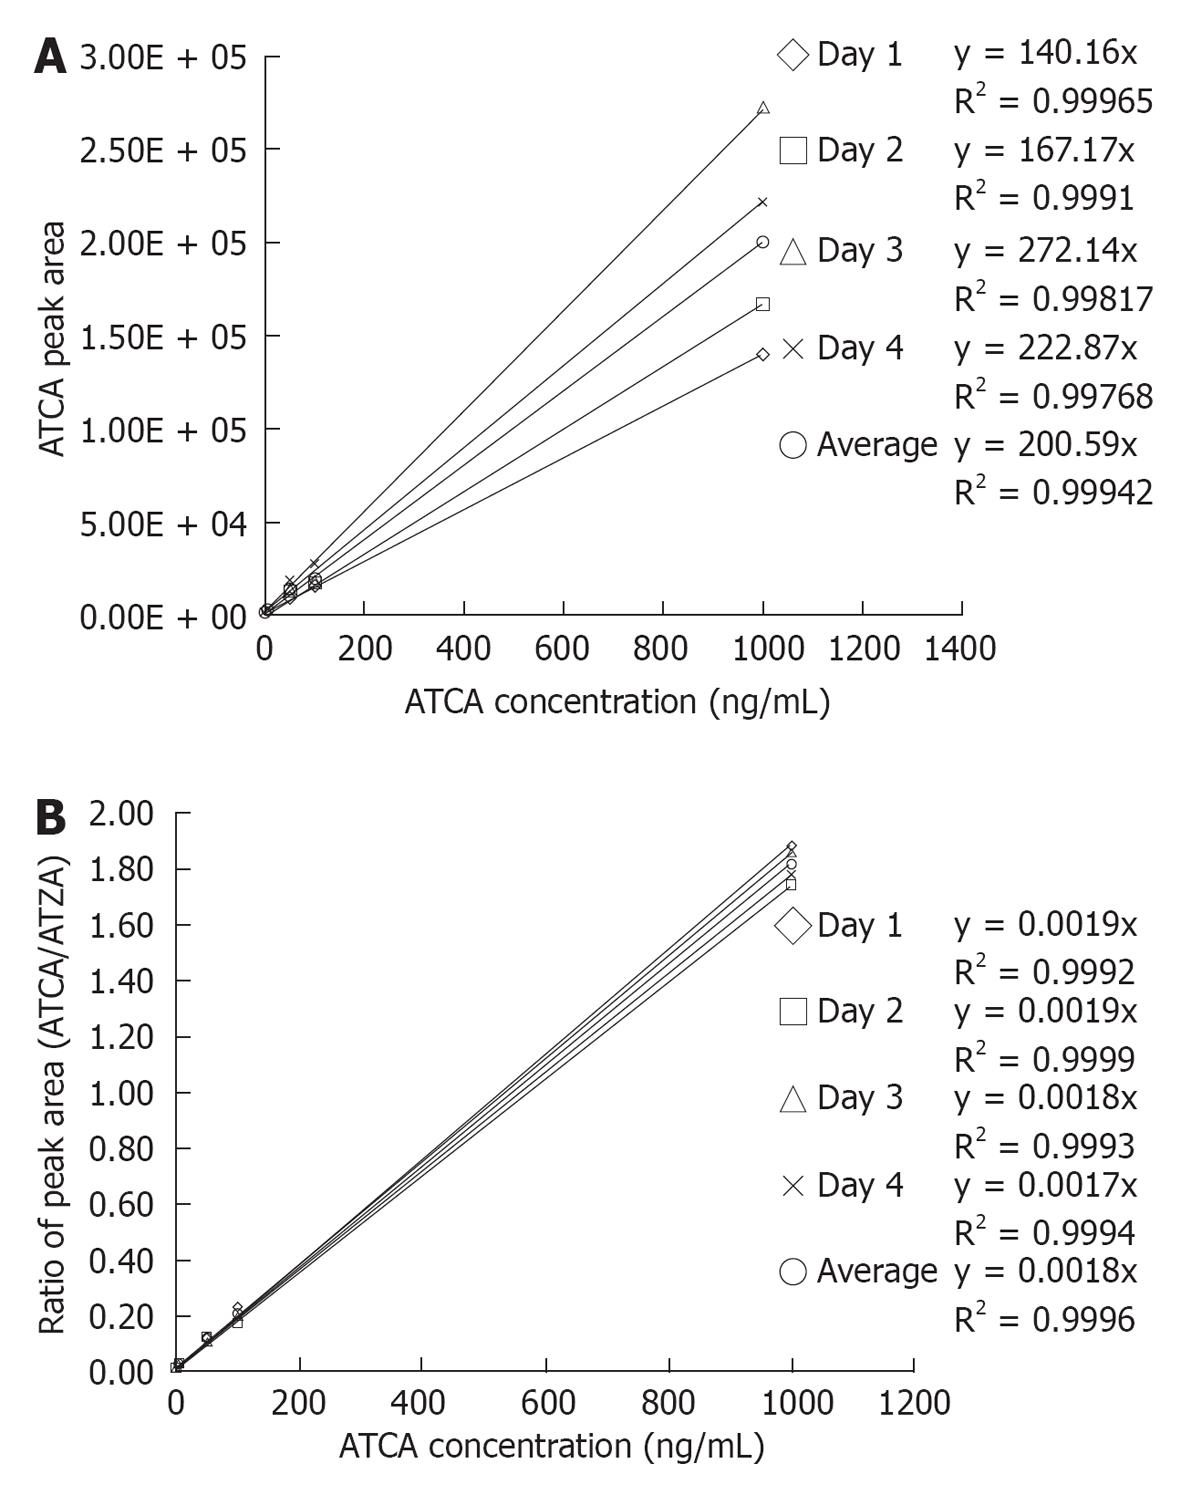
Figure 4 External calibration curves, without using 2-aminothiazole-4-carboxylic acid as the internal standard (A) and internal standard calibration curves constructed using 2-aminothiazole-4-carboxylic acid as the internal standard (B).
A: The external standard calibration curves showed good linearity over the tested 2-aminothiazoline-4-carboxylic acid (ATCA) concentration range with average R2 = 0.999 in a between-days experiment. The dashed lines show linear regression of calibration in each day. These linear regression lines yielded an average calibration equation y = (199 ± 60) × (n = 4), relative standard deviation (RSD) of calibration slopes = 30%. The high %RSD of the slopes indicated a typical ionization suppression effect of electrospray ionization. Internal calibration curves were next prepared by plotting the ratio of ATCA to 2-aminothiazole-4-carboxylic acid (ATZA) peak areas vs ATCA concentration; B: Ratioing to the internal standard peak area improved the reproducibility of the calibration curves. The dashed lines show calibration curves obtained on different days. These internal standard compensated calibration curves yielded an average calibration equation y = (0.018 ± 0.00007) × (n = 4), RSD = 4%. The decrease of the RSD from 30% (external calibration) to 4% (internal standard calibration) demonstrated that the internal standard, ATZA, enables effective compensation for ionization suppression and matrix effects, and substantially improves the precision with which ATCA can be quantified.
- Citation: Yu JC, Martin S, Nasr J, Stafford K, Thompson D, Petrikovics I. LC-MS/MS analysis of 2-aminothiazoline-4-carboxylic acid as a forensic biomarker for cyanide poisoning. World J Methodol 2012; 2(5): 33-41
- URL: https://www.wjgnet.com/2222-0682/full/v2/i5/33.htm
- DOI: https://dx.doi.org/10.5662/wjm.v2.i5.33


