Copyright
©The Author(s) 2025.
World J Methodol. Jun 20, 2025; 15(2): 99300
Published online Jun 20, 2025. doi: 10.5662/wjm.v15.i2.99300
Published online Jun 20, 2025. doi: 10.5662/wjm.v15.i2.99300
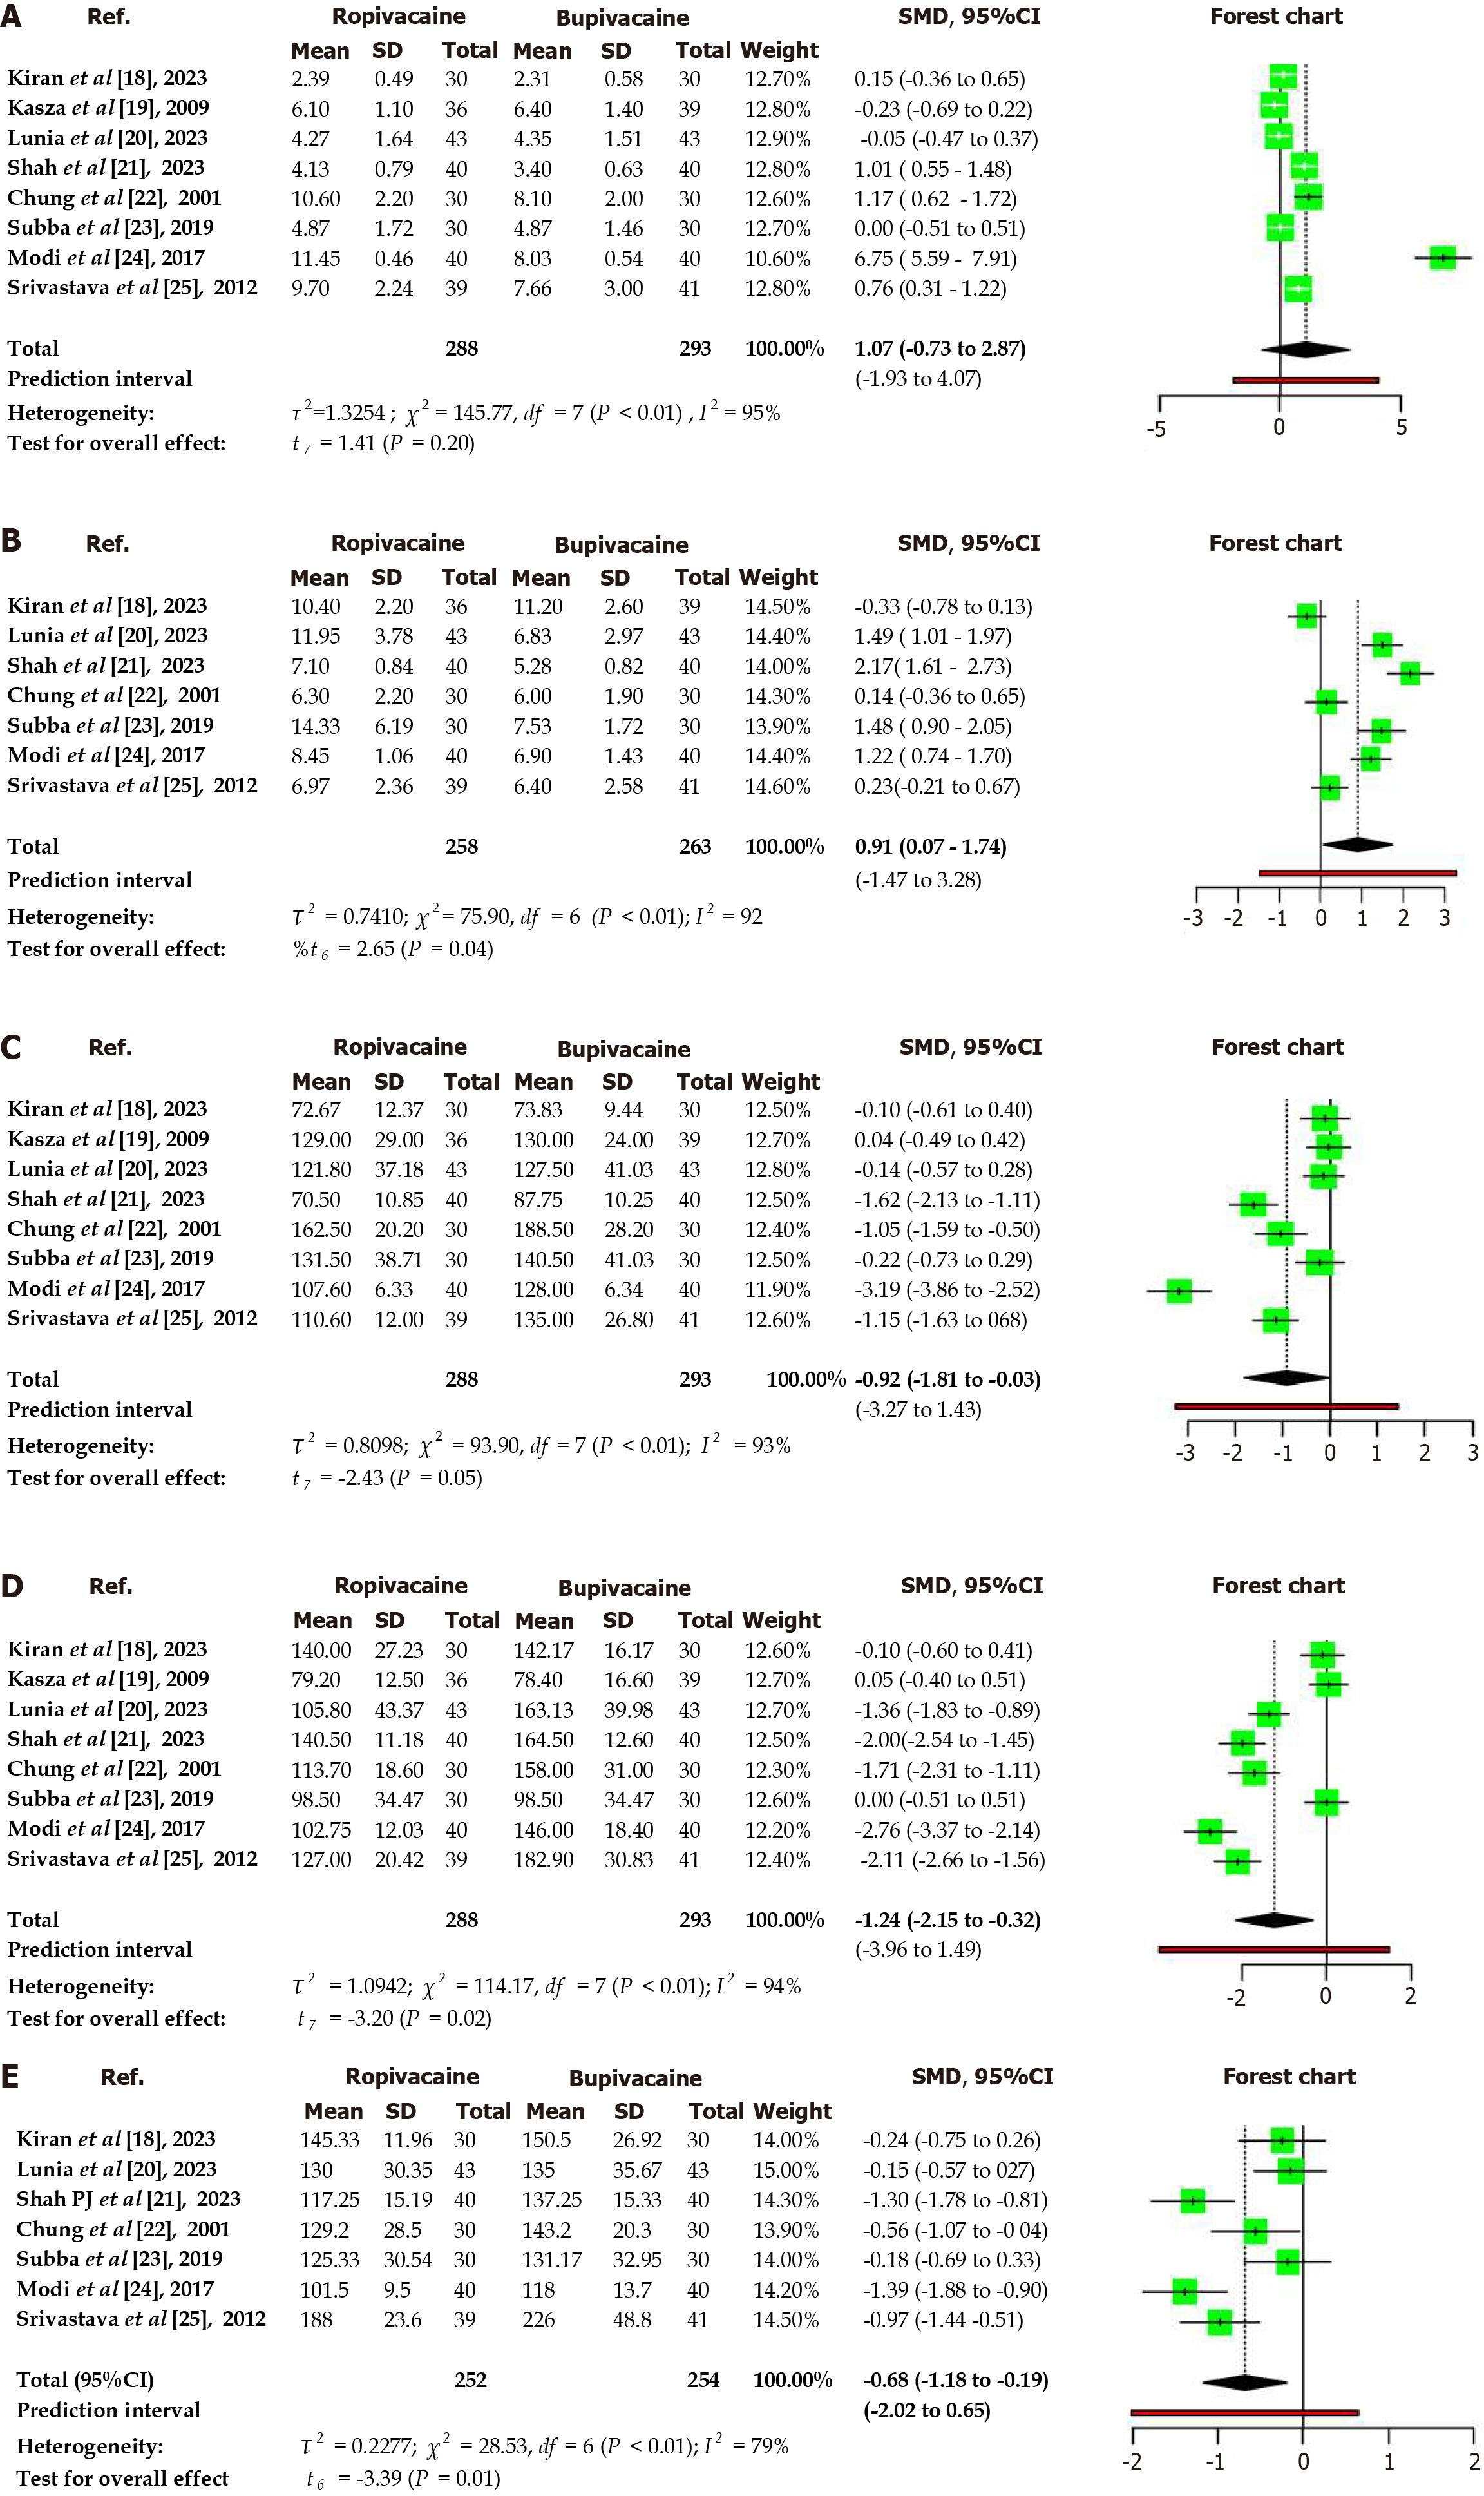
Figure 3 Forest chart and continuous variables.
A: Forest chart, onset of sensory blockade to maximal level; B: Forest chart, time to complete motor blockade; C: Forest chart, time for sensory blockade regression; D: Forest chart, time to recover from motor blockade; E: Forest chart, duration of analgesia.
- Citation: Anand R, Nag DS, Patel R, Sharma P, Uppalapati VK, Singh UK. Comparative efficacy of hyperbaric bupivacaine vs hyperbaric ropivacaine in spinal anesthesia for cesarean section: A meta-analysis. World J Methodol 2025; 15(2): 99300
- URL: https://www.wjgnet.com/2222-0682/full/v15/i2/99300.htm
- DOI: https://dx.doi.org/10.5662/wjm.v15.i2.99300


